


You open Shopify in the morning, see carts coming in, and expect the day to build. By lunch, traffic looks decent, product pages are getting attention, and a few customers have clearly shown buying intent. Then orders lag behind what the cart activity seemed to promise.
That gap is where a lot of stores lose money.
It’s easy to treat that loss like bad luck, weak demand, or “normal ecommerce behavior.” But once you start looking at Shopify abandoned cart analytics the right way, the picture gets much clearer. Revenue usually isn’t disappearing randomly. It’s leaking from a specific point in the journey.
Sometimes people never start checkout. Sometimes they begin checkout and stall. Sometimes your checkout works fine, but your follow-up timing is off. That’s why a single abandonment percentage rarely helps on its own.
A better approach is to read abandonment in layers. First, look at raw abandoned checkouts. Then look at funnel conversion. Then look at recovery performance. That gives you a practical way to decide whether you need to fix checkout UX, improve recovery timing, or clean up your tracking.
If you want extra context on the operational side of reducing lost checkouts, this playbook by MD TECH TEAM is a useful companion read. And if you’re still narrowing down the likely causes behind drop-offs, CartBoss also has a helpful breakdown of why customers abandon their carts.
Table of Contents
- Introduction Why Your Shopify Sales Disappear Before Checkout
- What Shopify Abandoned Cart Analytics Really Means
- Key Metrics to Track for Recovery Performance
- How to Interpret Your Abandoned Cart Data Like a Pro
- Common Pitfalls That Distort Your Analytics
- Actionable Ways to Improve Recovery With Analytics and SMS
- Your Next Steps to Turn Analytics Into Revenue
Introduction Why Your Shopify Sales Disappear Before Checkout
The frustrating part about cart abandonment is that shoppers already raised their hand. They clicked into products, added items, and signaled intent. You didn’t lose a casual browser. You lost someone who was close enough to buy.
That’s why this isn’t just a traffic problem. It’s a measurement problem first.
The leak usually starts before payment
A large Shopify-focused analysis found a measured cart abandonment rate of 76.04% across 958 stores, 24M+ visitors, and 2M carts in the first half of 2026. It also reported that 58% of Shopify cart users never even start checkout, while 43% of those who do begin checkout still fail to finish (Growth Suite cart abandonment statistics).
Those numbers matter because they show two different leaks:
- Early leak: shoppers add to cart but never move to checkout.
- Late leak: shoppers enter checkout but don’t complete the order.
If you only track one headline abandonment rate, those two problems get mashed together. You can’t tell whether to work on product-page intent, checkout friction, or recovery messages.
Practical rule: Don’t ask only, “What’s my abandonment rate?” Ask, “At which stage am I losing the order?”
A simpler way to think about the data
Think of your store like a physical shop.
A customer puts items in a basket. That’s one signal.
They walk to the register. That’s a stronger signal.
They start giving their details, then leave. That’s a very specific recovery opportunity.
Shopify gives you data for each of those moments, but not in one neat place. That’s where merchants get confused. The dashboards are useful, but they answer different questions.
The stores that recover more revenue usually build one habit: they stop treating abandonment as a mystery and start treating it like a system they can inspect every week.
What Shopify Abandoned Cart Analytics Really Means
A shopper adds two items, clicks checkout, types an email, then disappears. Another shopper adds three items and leaves before checkout even starts. Both feel like “abandoned carts” to a store owner, but Shopify does not record them the same way.
That difference is the whole point of abandoned cart analytics.
Cart, checkout, and abandoned checkout mean different things in Shopify
Shopify uses three separate signals of buying intent:
- A cart means someone added products.
- A checkout means someone entered the checkout flow.
- An abandoned checkout means Shopify created a checkout record, collected contact information, and the order still was not completed, according to Shopify’s abandoned checkout resource documentation.
That last definition is narrower than many merchants expect. If a shopper never begins checkout, they can hurt your conversion rate, but they usually will not appear in your abandoned checkout list.
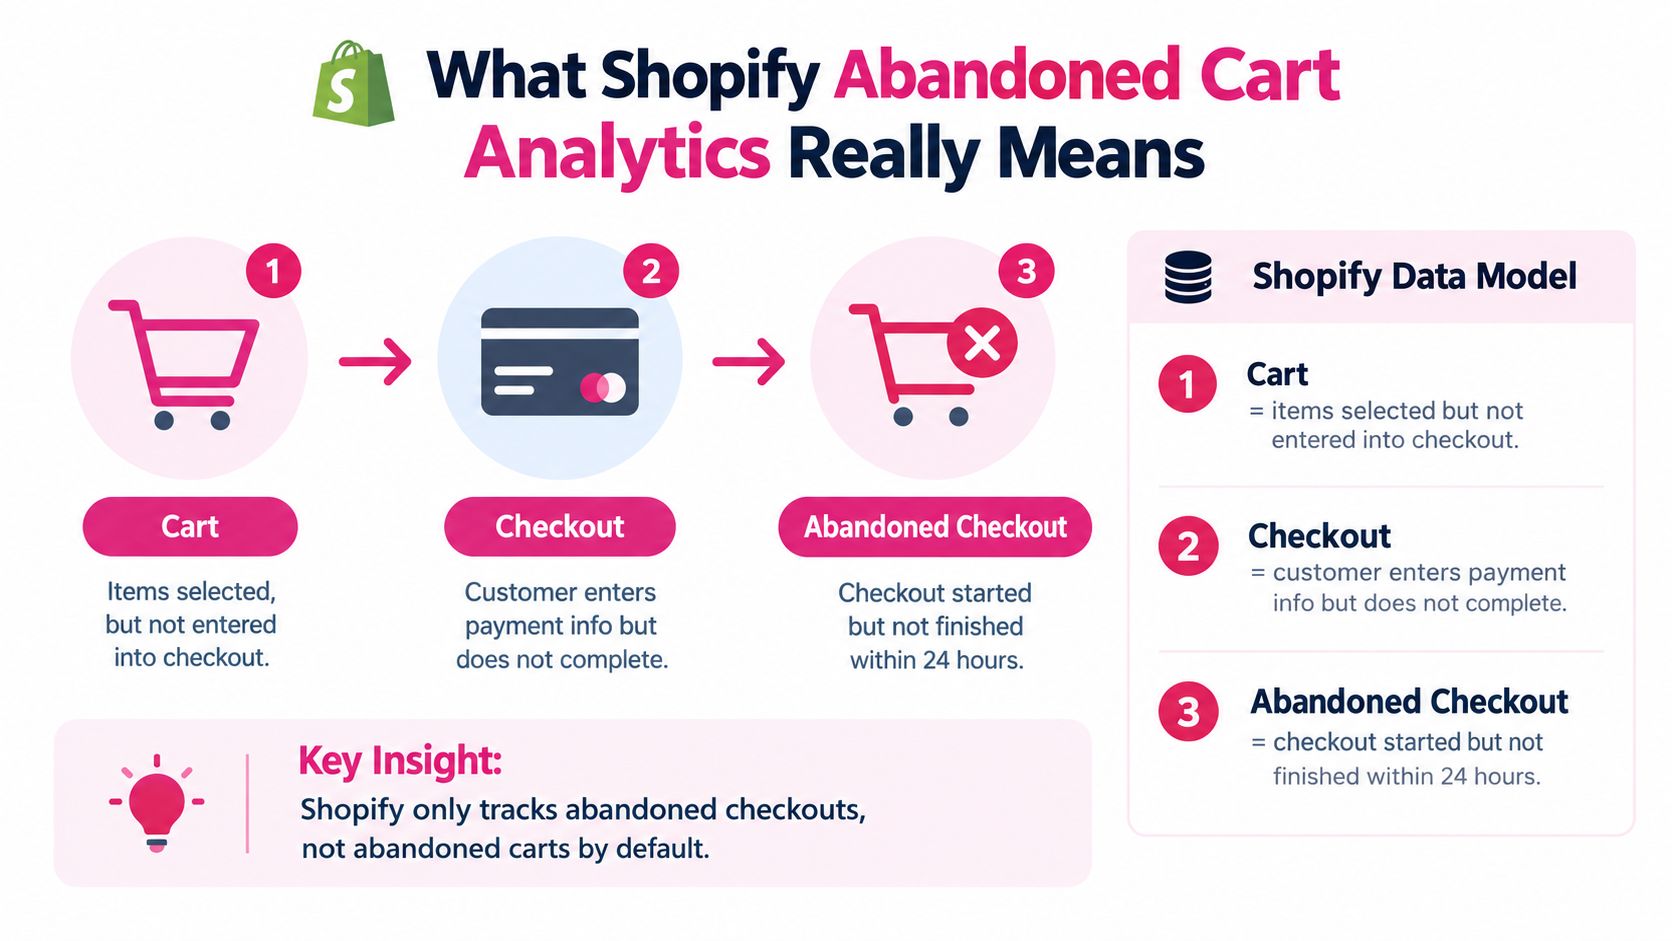
A physical store comparison helps here. A customer who puts a shirt in a basket has shown interest. A customer who walks to the register has shown stronger intent. A customer who starts giving contact details and then walks out has created a clear recovery chance.
Shopify tracks that last moment most directly.
Read abandoned cart analytics in three layers
Many reporting mistakes happen because merchants try to force one number to explain several different problems. A better method is to split the data into three layers.
-
Raw abandoned checkouts
These are the individual checkout records. You can see who left, what they planned to buy, cart value, and whether they later returned. -
Funnel conversion
This shows where shoppers drop between add to cart, checkout start, and completed purchase. It answers a different question: where is the buying journey breaking? -
Recovery performance
This measures what happened after your follow-up. Did your reminder emails or SMS bring people back? Did they recover high-value carts or only low-value ones?
This three-layer view makes diagnosis much easier. If add-to-cart is healthy but checkout starts are weak, your issue is earlier in the funnel. If checkout starts are strong but abandoned checkouts pile up, the checkout experience may need attention. If shoppers abandon checkout and your recovery rate stays low, the message timing, channel, or offer likely needs work.
Where to find each layer inside Shopify
Shopify does not place all three layers in one tidy report, which is why this topic confuses so many operators.
- Orders → Abandoned checkouts is where you review individual checkout records and recovery status. A practical walkthrough appears in this guide to tracking abandoned carts in Shopify analytics.
- Analytics → Reports → Online store conversion over time is better for understanding funnel movement across sessions, checkout starts, and purchases. This guide to cart abandonment analytics in Shopify explains that view clearly.
Those reports answer different questions, so they should not be blended into one headline percentage.
Why this changes how you act on the numbers
A single abandonment rate can tell you that revenue is leaking. It cannot tell you where to put your effort first.
Use this simple rule instead:
- Low checkout starts usually point to cart-page or pre-checkout friction.
- High checkout abandonment usually points to checkout UX, trust, shipping cost, or payment friction.
- High abandonment with poor recovery results usually points to weak follow-up timing or messaging.
That is what Shopify abandoned cart analytics really means. It is not one score. It is a system for separating checkout loss from funnel loss, so you can fix the right problem first.
Key Metrics to Track for Recovery Performance
A lot of stores track one abandonment number and stop there. That is like checking total water loss without looking at which pipe is leaking.
For recovery work, you need a small scorecard across all three layers. One metric shows how many shoppers left a checkout. Another shows whether people are reaching checkout in the first place. A third shows whether your follow-up messages bring them back.
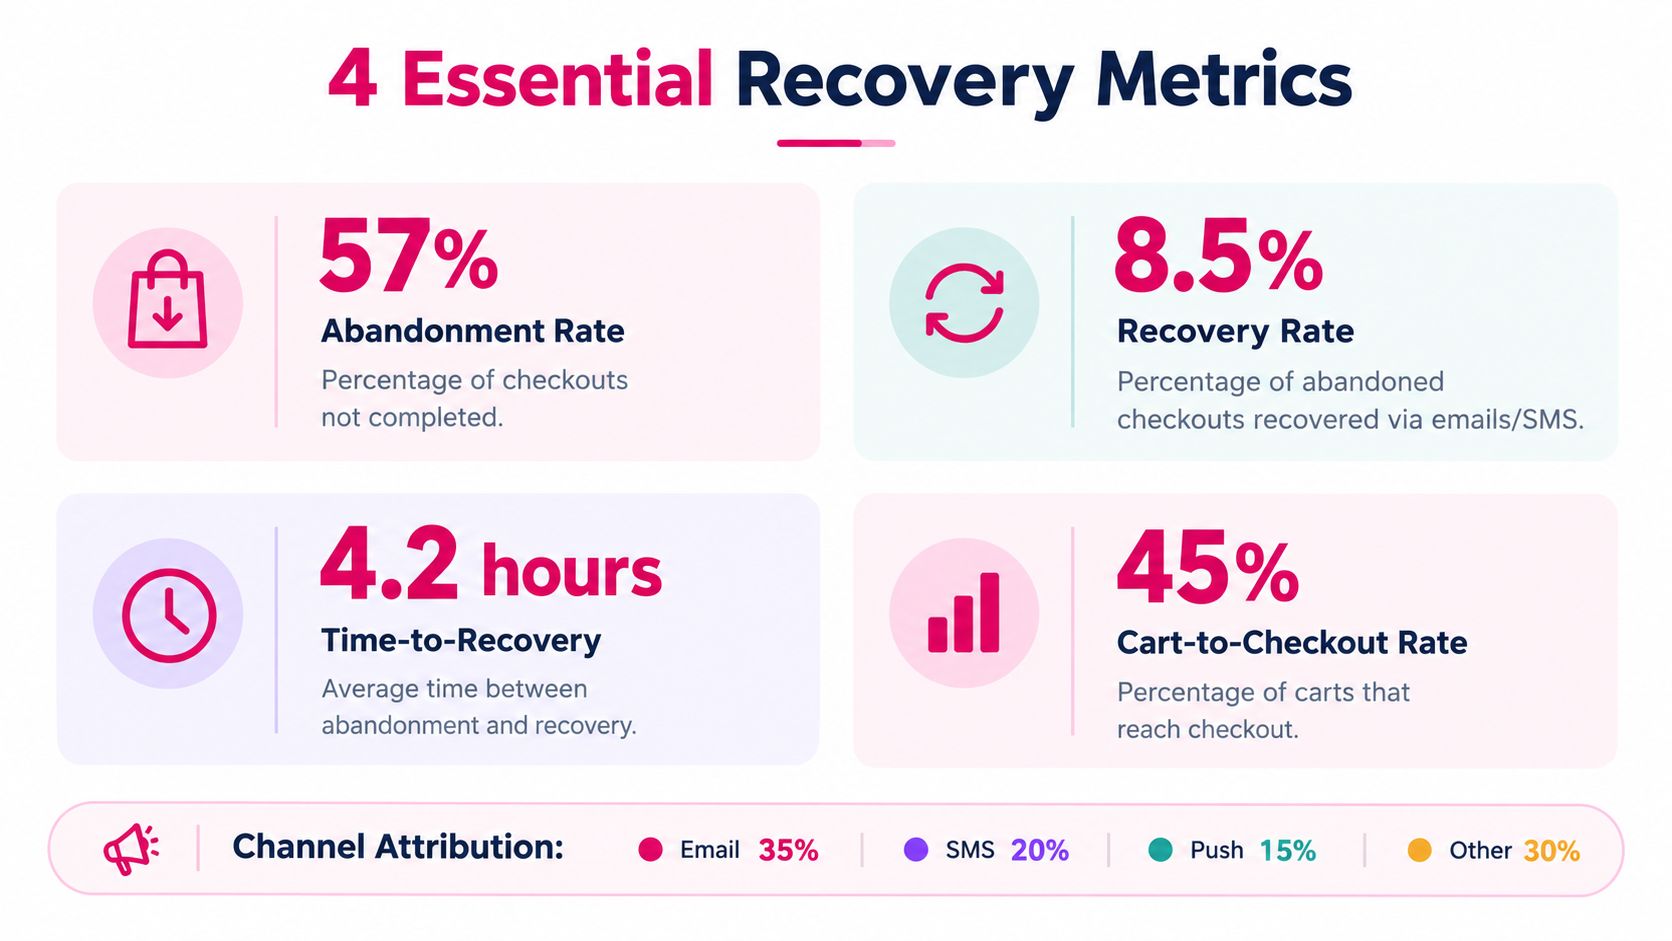
The four core metrics
1. Abandoned checkout rate
Start with the late-stage loss number.
Simple formula:
- Abandoned checkout rate = abandoned checkouts ÷ checkout starts
Use this rate to measure checkout-stage friction. If it climbs, shoppers are getting close to buying and then backing out. That often points to shipping cost, payment friction, forced account creation, slow checkout on mobile, or trust concerns.
What it tells you:
- Useful for: measuring loss inside checkout
- Not enough for: judging your full funnel or your recovery workflow
Keep the definition steady from week to week. If one report uses carts created and another uses checkout starts, the trend will look messy even if shopper behavior did not change.
2. Recovery rate
This shows how many abandoned checkouts returned and placed an order after your reminder flow.
Simple formula:
- Recovery rate = recovered abandoned checkouts ÷ total abandoned checkouts
This is the performance layer. If abandonment is high but recovery rate is healthy, your follow-up may be doing its job and the bigger fix is inside checkout. If abandonment is moderate but recovery rate is weak, your message timing or channel mix needs attention. For a clear formula and example, CartBoss has a useful guide on how to calculate recovery rate.
What it tells you:
- Whether your recovery messages are bringing back lost buyers
- Whether changes to timing, copy, or incentives improved results
3. Time to recovery
Recovery speed matters because buyer intent cools off fast.
Simple formula:
- Time-to-recovery = time between abandonment and completed recovered order
This metric helps you answer a practical question. Did shoppers come back after the first reminder, or only after later touches? If most recovered orders happen quickly, your first message carries most of the load. If recoveries cluster later, your sequence timing may be too slow or your first message may be too easy to ignore.
Many teams pull this from app reports or by comparing abandoned checkout timestamps with order timestamps.
4. Recovery channel performance
You also need to know which follow-up channel created the return visit and order.
Look at:
- Email recoveries
- SMS recoveries
- Other tracked recovery paths
Review each channel by completed orders, revenue, conversion rate, and average order value. As noted earlier, Shopify separates these views across different reporting areas, so the goal is to compare channel outcomes, not to hunt for one perfect report.
Two supporting metrics that sharpen the diagnosis
-
Cart-to-checkout rate
This is your handoff metric between funnel activity and checkout intent. If carts are healthy but few shoppers start checkout, recovery messages will not solve the main problem. The friction is earlier. -
Offer acceptance
If a discount or incentive appears in your recovery flow, track how often it gets used. A rising acceptance rate can help revenue, but it can also warn you that shoppers need a push they should not need in the first place.
A simple way to read these together is to treat them like a three-layer scorecard:
- Layer 1: Raw abandoned checkouts tells you how many checkout opportunities were left behind.
- Layer 2: Funnel conversion tells you whether shoppers are reaching checkout often enough.
- Layer 3: Recovery performance tells you whether your follow-up recaptures part of that loss.
That framing keeps you from blaming the wrong system. A checkout problem and a recovery problem can produce similar revenue pain, but the fix is different.
Keep finance tied to the same view
Recovered orders affect revenue timing, discount reporting, and channel attribution. As order volume grows, clean reporting matters because your marketing numbers and your books need to line up. This founder guide to ecommerce bookkeeping is a solid reference for connecting store activity back to cleaner books.
A simple weekly tracking checklist
- Check your definitions: Are you measuring carts, checkout starts, or abandoned checkouts?
- Review cart-to-checkout rate: Are shoppers reaching checkout at a normal rate?
- Review abandoned checkout rate: Are more buyers dropping during checkout itself?
- Check recovery rate: Are your reminders bringing people back?
- Review time-to-recovery: Do recovered orders happen after the first touch or later?
- Compare channels: Which recovery path produced orders, not just clicks?
How to Interpret Your Abandoned Cart Data Like a Pro
Raw numbers don’t help much until you compare them by segment and by stage.
A strong Shopify abandoned cart analytics habit looks less like staring at one chart and more like asking a short set of questions. Which device loses the most buyers? Which traffic source produces weak checkout intent? Which products get added often but rarely make it through checkout?
Read the funnel from left to right
Start with your online store conversion flow:
Sessions → Product views → Add to cart → Reach checkout → Purchase
This view shows where intent weakens. Your abandoned checkout list shows who reached the later stage and still left. Put those together and the diagnosis gets sharper.
For example:
- If product views are healthy but add-to-cart is weak, the problem isn’t checkout.
- If add-to-cart is healthy but reach checkout is weak, something between cart and checkout is causing friction.
- If reach checkout is healthy but purchases are weak, then checkout experience or recovery timing deserves attention.
If you want a stronger habit around reading traffic patterns before making funnel changes, this guide on how to analyze website traffic is worth keeping close.
Diagnose by segment, not just by total
Independent benchmark summaries note that mobile abandonment is consistently higher than desktop in broader ecommerce research, and they also show why small changes matter when the denominator is large. One example given is a store with 10,000 checkout starts and a 70% abandonment rate losing about 7,000 opportunities, where even a 3 to 5 percentage point reduction can recover hundreds of orders (SQ Magazine ecommerce conversion statistics).
That’s why totals can fool you. A blended store-wide rate can look “fine” while one segment is bleeding.
Useful segment cuts:
- Device: mobile versus desktop
- Traffic source: paid social, search, email, direct
- Product type: low-consideration items versus bundles or gift purchases
- Funnel stage: cart drop-off versus checkout drop-off
Diagnose Your Drop Off by Funnel Stage
| Funnel Stage Signal | What It Means | Priority Fix to Test |
|---|---|---|
| Lots of product views, weak add-to-cart | Product page isn’t building enough buying intent | Improve product clarity, shipping visibility, trust signals |
| Strong add-to-cart, weak reach checkout | Friction between cart and checkout | Simplify cart, reduce surprise costs, improve checkout entry |
| Strong reach checkout, weak purchase | Checkout friction is likely blocking completion | Review fields, payment options, speed, mobile usability |
| Decent checkout completion but weak recovered orders | Recovery setup is underperforming | Test message timing, channel mix, and offer structure |
| Strong recovery rate but poor overall conversion | Recovery is compensating for a weak front-end experience | Fix checkout UX first, then optimize recovery |
Don’t read abandonment as one leak. Read it like a pipe system. The repair depends on where the pressure drops.
A simple decision rule
If the problem appears before checkout starts, work on prevention.
If the problem appears after checkout starts, work on checkout completion.
If the checkout is healthy but too many shoppers still leave, improve recovery timing and message relevance.
That’s the practical difference between reporting and diagnosis.
Common Pitfalls That Distort Your Analytics
Most bad decisions in abandonment work don’t come from a lack of data. They come from mixing unlike numbers and drawing the wrong conclusion.
Pitfall one treats abandonment like one number
A merchant sees a store-wide abandonment rate and decides everything is broken. Another sees a decent recovery rate and assumes things are under control. Both can be wrong.
Different definitions produce different rates. One large Shopify sample reported 76.04% abandonment based on its own store set, while broader benchmark articles often cite around 70% from different study pools and methods, as discussed in the earlier measurement source. Those numbers aren’t directly interchangeable.
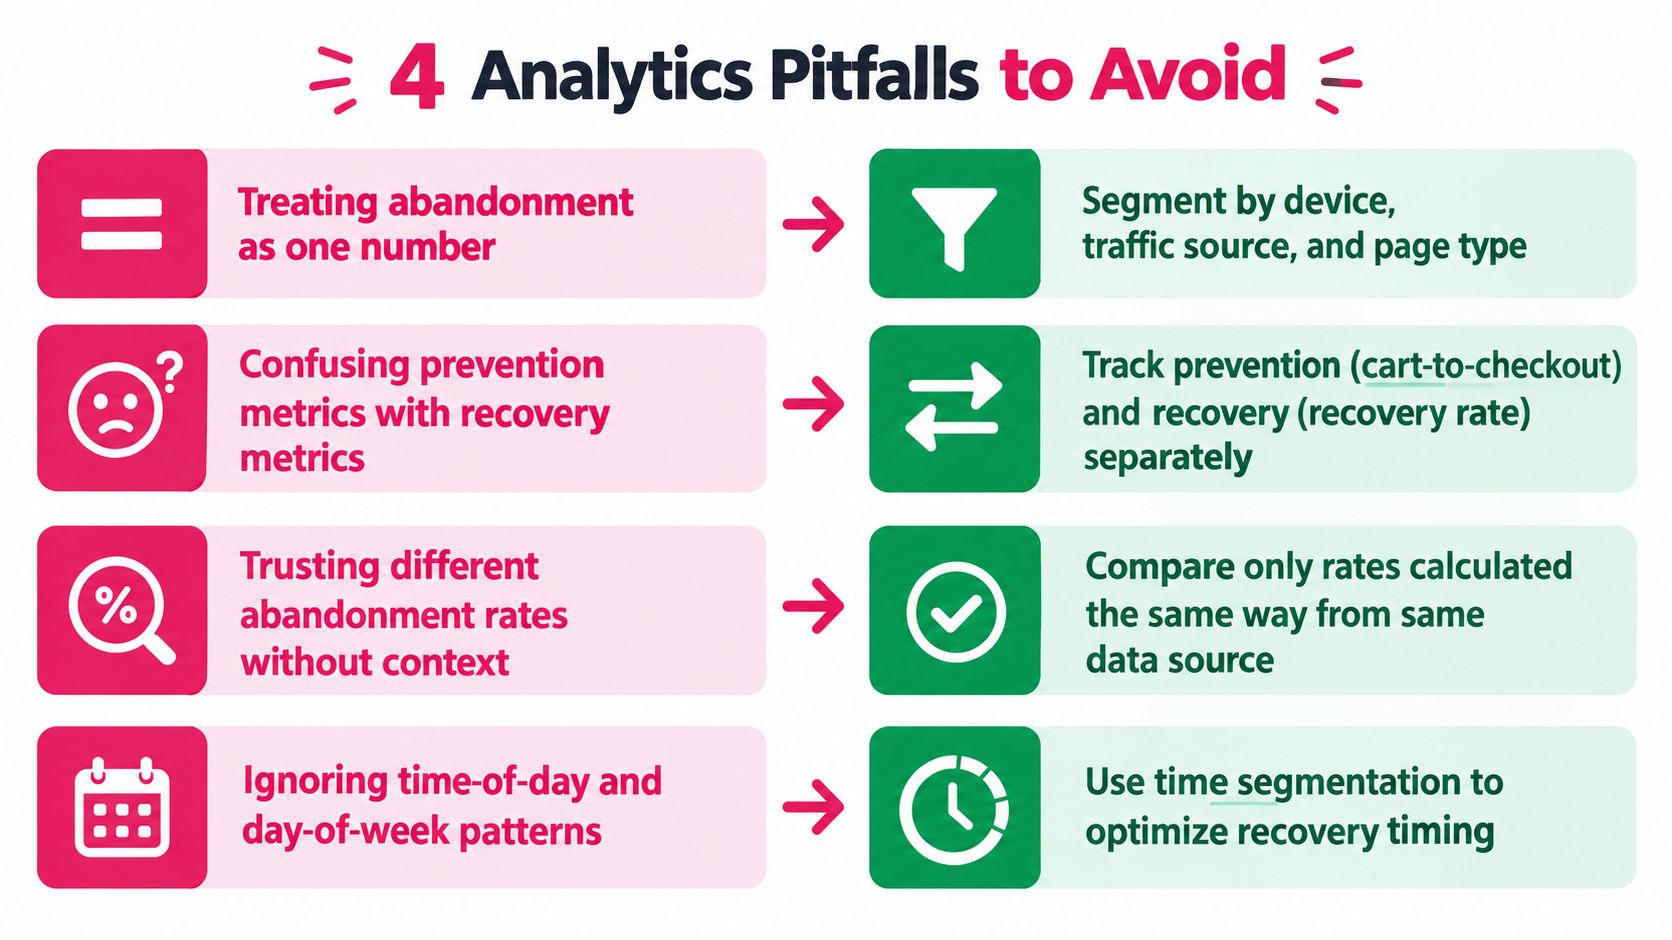
Pitfall two mixes prevention with recovery
A low cart-to-checkout rate and a low recovery rate are not the same issue.
One points to front-end friction. The other points to follow-up performance, audience quality, or tracking. If you combine them into one dashboard tile, you’ll end up fixing the wrong thing.
Pitfall three lets a strong recovery result hide weak checkout UX
This one catches a lot of teams.
Your SMS or email flow can bring back a meaningful share of lost shoppers, but that doesn’t mean your checkout experience is healthy. Recovery should recover avoidable loss. It shouldn’t carry the entire conversion system on its back.
A recovery campaign can look good while your checkout still leaks hard.
Pitfall four blames the campaign when tracking is broken
Weak recovery numbers don’t always mean weak messages.
Sometimes the issue is:
- Missing events: the abandonment trigger didn’t fire consistently
- Channel mismatch: the shopper came back through another path and the recovery tool didn’t get credit
- Incomplete attribution setup: recovered revenue appears elsewhere
Before you rewrite copy or change discounts, run a short validation pass.
Quick analytics sanity check
- Definition check: Are you measuring carts, checkout starts, or abandoned checkouts?
- Record check: Does the abandoned checkout list reflect real shopper activity from the same period?
- Funnel check: Do your conversion reports align directionally with the abandoned checkout count?
- Attribution check: Are recovered orders being matched back to the reminder channel consistently?
- Segment check: Are results weak everywhere, or only in one device or traffic source slice?
That quick review usually saves hours of random testing.
Actionable Ways to Improve Recovery With Analytics and SMS
A shopper adds products, starts checkout on their phone, gets distracted, and disappears. By the time you check reports, all you see is one big abandonment number. That number is too blunt to help.
Use a three-layer view instead. First, look at raw abandoned checkouts. Then look at funnel conversion. Then look at recovery performance. That simple stack helps you answer the question: should you fix checkout friction, or should you fix follow-up timing?
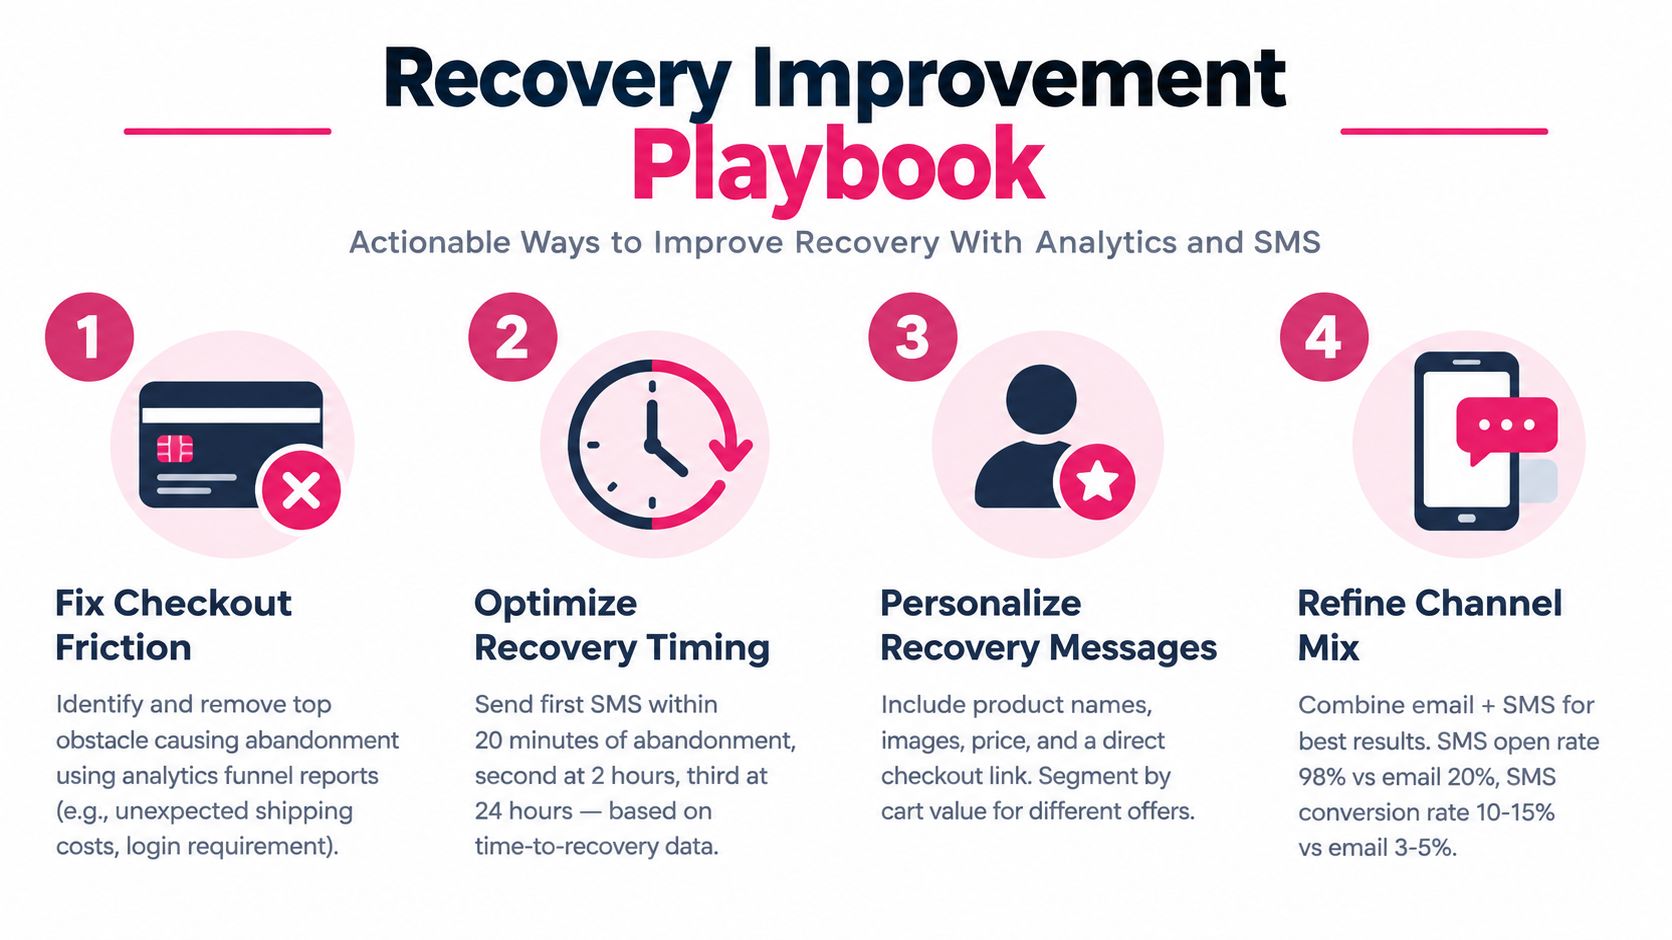
1. Fix checkout friction first when the leak is inside checkout
If many shoppers begin checkout but only a small share finish, start there.
A recovery message cannot fully rescue a checkout that feels annoying, confusing, or slow. It works like a bucket with a hole. Pouring in more reminders does not help much if buyers keep slipping out at the same step.
Check for:
- Unexpected costs: shipping, taxes, or fees that appear late
- Mobile friction: small fields, awkward input, slow loading
- Forced account creation: buyers often want the fastest path to payment
- Payment gaps: missing methods can stop ready-to-buy shoppers
Do two quick checks. Review a small sample of abandoned checkout records. Then complete your own checkout on mobile from product page to payment. You are looking for places where a willing buyer might hesitate.
2. Speed up recovery when checkout looks healthy
Sometimes the store flow is fine. The shopper got interrupted.
That is a recovery timing problem, not a checkout UX problem. In that case, review how long it usually takes for recovered shoppers to come back, and compare early reminders with later ones. If most recoveries happen soon after abandonment, your first message may need to go out earlier. If late messages rarely bring anyone back, they may be adding noise.
SMS is useful here because it reaches shoppers quickly and sends them back with less effort. CartBoss is one example of a tool that supports automated SMS cart recovery, pre-filled checkout forms, dynamic discount application, language detection, and compliance settings such as GDPR, CCPA, and do-not-disturb mode.
If you want a practical channel walkthrough, see this guide to Shopify abandoned cart recovery with text messages.
Here’s a useful video if you want to see the topic explained in a more visual format:
3. Personalize the follow-up so the return feels easy
A good recovery message should feel like a helpful nudge, not a generic promotion.
Include:
- Cart context: product names or the item category they left behind
- Direct return path: send them back to checkout, not to the homepage
- Language fit: use the customer’s likely language where possible
- Offer logic: reserve incentives for cases where your tests show they help
A simple SMS template
You left something behind in your cart. Your checkout is ready, and you can complete your order here: [checkout link]
Keep discounts on a short leash. If the underlying issue is form friction or weak payment options, a coupon can hide the problem for a while without fixing it.
4. Measure each change in the right layer
After you change anything, read the result in the same three layers.
-
Raw abandoned checkouts
Did the volume or pattern of abandonment change? -
Funnel conversion
Did more shoppers move from cart to checkout, or from checkout to purchase? -
Recovery performance
Did recovery rate, time-to-recovery, or channel-attributed orders improve?
This keeps your diagnosis clean. Better SMS results can happen while checkout still underperforms. Better checkout conversion can also reduce how much you need discount-driven recovery. Both are wins, but they solve different problems.
Your Next Steps to Turn Analytics Into Revenue
A shopper adds a product, starts checkout, then disappears. Another shopper does the same thing, but comes back after an SMS and buys. On the surface, both look like “abandoned carts.” In practice, they point to two different jobs. One asks you to fix checkout. The other asks you to improve recovery.
That is why your next step is not to watch one abandonment percentage and hope it drops. Use the three-layer view you built in this article as a weekly operating habit.
Start with a short review each week and keep it focused:
- Raw abandoned checkouts: who left, what they left behind, and whether the same products, devices, or traffic sources show up again
- Funnel conversion: where shoppers slow down, such as cart to checkout or checkout to purchase
- Recovery performance: which follow-ups brought people back, how fast they returned, and which segments responded best
This works like checking a store in three places. The front door tells you who came in. The checkout counter shows where the line gets stuck. The call-back list shows who came back after a reminder. If you only watch one number, you miss where the actual problem lives.
Pick one pattern. Then pick one fix.
Good examples include:
- simplifying a mobile checkout step
- reviewing paid social traffic that starts carts but rarely reaches checkout
- sending recovery messages earlier for shoppers who usually buy fast
Keep the test small so the result is clear. If checkout conversion improves, you solved a funnel problem. If recovered orders improve but checkout still stalls, your recovery got better while the checkout issue remains. That distinction matters because it tells you where to spend your next hour.
A simple rule helps here. Fix the leak before you add a bigger bucket.
If you want a practical framework for making changes this way, CartBoss has a useful article on data-driven decisions for ecommerce teams.
CartBoss helps Shopify stores act on abandoned cart data with automated SMS recovery, pre-filled checkout links, language-aware messaging, and reporting that makes it easier to see what is bringing shoppers back. If you want a practical way to turn your Shopify abandoned cart analytics into recovered orders without adding manual follow-up work, CartBoss is one option to review.