
A B2B customer journey map is supposed to be a visual guide to how a business customer finds, evaluates, and ultimately buys from you. It’s meant to document their entire path—including their actions, what they’re thinking, and how they’re feeling—from that very first glimmer of awareness all the way through to purchase and becoming a vocal fan.
Why Your B2B Journey Map Is Broken (And How to Fix It)
Let’s be honest for a second. Most B2B customer journey maps are just dressed-up internal process documents. They show how we, the company, think a sale should go down, not how a customer actually experiences it.
This inside-out view is the number one reason most maps fail to add any real value. They end up as just another flowchart collecting digital dust on a server somewhere.
A truly powerful map is built on a complete change in perspective. It has to be a tool for empathy, forcing you to step directly into your buyer’s shoes. This is more critical than ever. Modern B2B buyers are on a tangled, non-linear path, armed with more information than ever and dealing with pressure from their own internal buying committees. They aren’t following your neat, clean stages.
The core problem with broken journey maps is that they reflect company processes, not customer experiences. A successful map prioritizes the customer’s goals, questions, and feelings at every single touchpoint.
When there’s a disconnect, you end up with painful gaps between your marketing, your sales process, and what your prospects actually need to move forward.
From Poor Leads to Quality Pipeline
Let me give you a real-world example. I once worked with a SaaS company that was drowning in poor-quality leads. Their marketing team was hitting their numbers, generating a ton of MQLs from content downloads. But the sales team was pulling their hair out, complaining that none of these leads were qualified or even ready to talk.
Their so-called “journey map” was a straight line: lead downloads a whitepaper, gets a sales call, then gets a demo. Simple, but completely wrong.
Once we sat down to build a genuine, customer-first B2B journey map, we uncovered some massive flaws in their thinking:
- The Buyer’s Real Goal: Prospects weren’t just “gathering information.” Their real job was to build a convincing business case to get budget approval from their boss.
- A Hidden Touchpoint: A surprising number of prospects first heard about the brand through employee reviews on sites like Glassdoor—a touchpoint the company had completely ignored.
- Emotional Friction: The immediate, aggressive sales call created a ton of anxiety and distrust. Prospects felt ambushed before they even had a chance to understand the product on their own terms.
This new, empathetic view sparked a total strategy overhaul. They started creating content specifically designed to help prospects build that internal business case. They also ditched the aggressive follow-up for a more educational, nurturing email sequence.
The result? The total MQL volume dipped slightly, but their MQL-to-SQL conversion rate more than doubled. Why? Because the leads who finally made it to sales were actually ready for the conversation.
If you’re ready to build a map that delivers real results, our guide on a customer journey mapping template is a great place to get started.
To truly fix a broken journey map, you have to embrace the massive shift to digital. With estimates suggesting that 80% of B2B sales interactions will happen digitally by 2025, understanding and polishing every digital touchpoint is no longer a “nice-to-have”—it’s essential for survival.
As you dive deeper, it’s worth exploring proven strategies for optimizing the customer journey, especially those that agile marketing teams are using to stay ahead.
How to Gather Data You Can Actually Use

Let’s be blunt: a B2B customer journey map built on assumptions is just a pretty work of fiction. To create a tool that actually drives business decisions, you have to ground it in solid evidence. It’s time to move past the guesswork and dig into the data that tells the real story of your customer’s experience.
The best maps I’ve ever seen always blend two types of data. Quantitative data shows you what is happening, while qualitative data explains why. Nail both, and you get a complete, actionable picture of the journey. Think of it as having both the satellite view and the street-level view of your customer’s world.
Tap into Your Internal Goldmine
You don’t need a massive research budget to get started. I promise you, your organization is already sitting on a treasure trove of information. The real trick is knowing where to look and what to ask. Your first stop should always be your customer-facing teams.
I always recommend scheduling structured interviews with your sales and customer success teams. Don’t just ask for vague feedback.
Get specific. Ask them things like, “What are the top three objections you hear on a first call?” or “At what point do you see a prospect’s enthusiasm just die?”
These conversations give you the raw, unfiltered truth about customer pain points and motivations—the kind of stuff that rarely makes it into the official CRM notes.
Dig into Your Systems and Analytics
Once you have those anecdotal stories, it’s time to back them up with hard numbers. Your existing tech stack is a goldmine for quantitative data that can highlight behavioral patterns at scale.
Start by digging into these key platforms:
- Customer Relationship Management (CRM): Your CRM is more than a digital rolodex. Look for patterns in deal velocity, common reasons for lost deals, and the shared traits of your most valuable customers. Of course, this only works if your data is clean. For your insights to be actionable, it’s crucial to focus on mastering CRM data hygiene.
- Web Analytics (e.g., Google Analytics): Fire up your user flow reports. See the exact paths people take through your site. Pay close attention to pages with high exit rates—they often signal friction or confusion in the journey.
- Marketing Automation Platform: Dive into your email engagement metrics and content download history. Which topics are hitting home with prospects at different buying stages?
This data provides the skeleton for your B2B customer journey map. It shows you the main highways your customers travel and, more importantly, reveals the critical drop-off points that need a closer look.
Go Directly to the Source
Internal data is a fantastic starting point, but nothing—and I mean nothing—beats hearing directly from your customers. This is how you understand their emotional state and uncover needs your own teams might not even see. And you can do it without being disruptive.
Try designing short, targeted surveys that focus on specific moments in the journey. Instead of a generic “How are we doing?” survey, ask a new customer, “What was the single most helpful piece of content you found while researching solutions?” This gives you specific, usable feedback.
You’ll probably find that different customer profiles have very different discovery paths. This is a perfect opportunity to explore different customer segmentation techniques to make your map even more powerful.
Also, don’t forget to use social listening tools to keep an eye on platforms like LinkedIn or niche industry forums. What questions are your ideal customers asking? What are they complaining about? This raw, unsolicited feedback gives you a real-time pulse on your market’s true priorities.
Bringing Your B2B Customer Journey to Life
You’ve done the hard work of gathering all that rich data. Now for the fun part: turning that raw information into a visual story. An effective B2B customer journey map is much more than a flowchart; it’s a powerful tool for building empathy across your entire organization. This is where you bring your buyer personas to life, charting their path from their perspective, not yours.
The golden rule here is to show only the customer’s actual experience. What do they see, feel, and do? That’s what goes on the map. Your complex, internal back-end processes have no place here. A customer placing an order online doesn’t know (or care) about your intricate fulfillment workflow, so leave it off their map.
Key Takeaway: A journey map must reflect the customer’s reality, not your company’s internal operations. This customer-first approach is non-negotiable for creating a map that drives real change.
How to Structure Your Visual Story
A common—and highly effective—way to structure your map is by defining key stages, identifying the touchpoints within those stages, and then documenting what the customer is doing, thinking, and feeling along the way. Think of it as creating a multi-layered narrative that anyone in your company can pick up and immediately understand.
The classic B2B journey stages provide a solid foundation:
- Awareness: This is the “aha!” moment. A prospect realizes they have a problem and starts trying to put a name to it. They aren’t looking for vendors yet; they’re just trying to understand the challenge itself.
- Consideration: Armed with a better understanding of their problem, the prospect starts actively researching potential solutions. This is when they begin comparing vendors, features, and pricing.
- Decision: The buying committee has done its homework and is ready to choose a partner. This stage covers everything from the final pitch and contract signing to implementation and onboarding.
To truly map this journey, you first need to know who is taking it. This is where well-defined buyer personas come in.
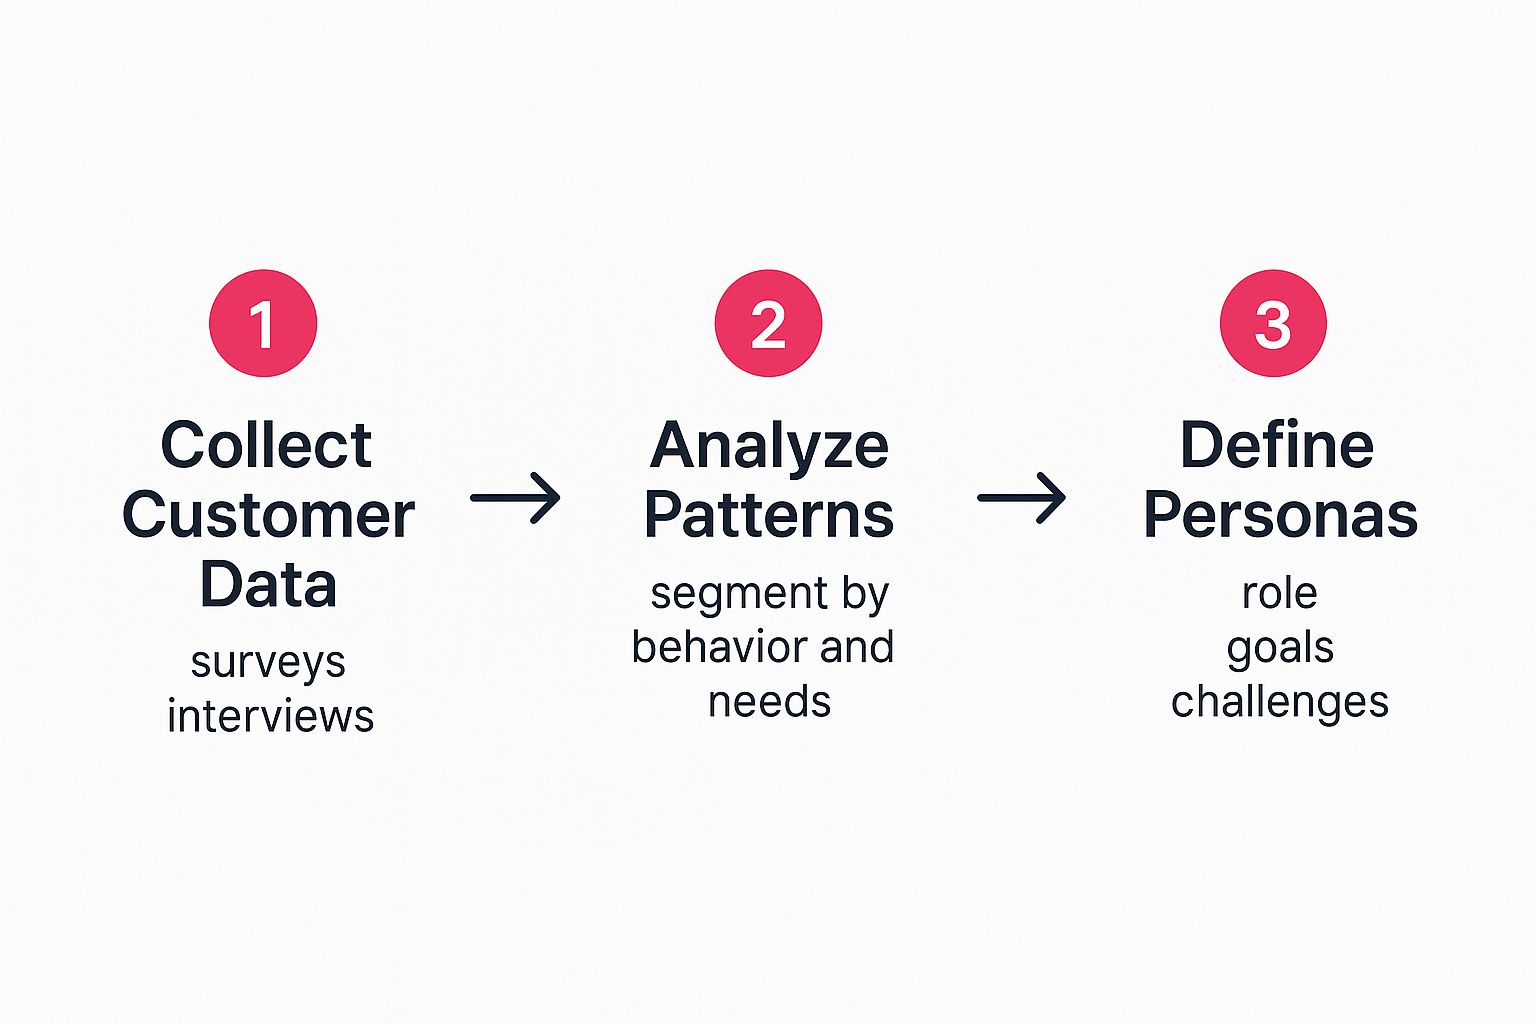
As the graphic shows, building accurate personas is a clear, three-part process: collecting the right data, analyzing it for patterns, and then defining the persona. You can’t start mapping without this foundational step.
To give you a comprehensive view, your map needs to capture several layers of information. The table below breaks down the essential components to include.
B2B Journey Map Components
| Component | Description | Example Data Source |
|---|---|---|
| Stages | The major phases the customer goes through, from initial awareness to post-purchase. | Industry frameworks, internal sales process |
| Actions | What the customer is physically doing at each touchpoint. | Web analytics, CRM activity logs, user recordings |
| Thoughts | The internal monologue—questions, concerns, and logic driving their decisions. | Customer interviews, surveys, sales call notes |
| Feelings | The emotional state of the customer (e.g., confused, anxious, hopeful, confident). | Sentiment analysis, survey feedback, support tickets |
| Pain Points | Frustrations or obstacles the customer encounters along the way. | Customer support logs, online reviews, sales feedback |
| Opportunities | Ideas for improving the experience and removing friction. | Brainstorming sessions, competitive analysis |
| Touchpoints | Any point of interaction between the customer and your brand or industry. | Google Analytics, social media insights, CRM |
Including each of these components ensures your map is not just a diagram, but a rich, actionable story that reveals exactly where you can make an impact.
A Real-World Manufacturing Example
Let’s make this concrete. Imagine a manufacturing equipment supplier mapping the journey of “Mark,” a procurement manager for a mid-sized factory.
Awareness Stage:
Mark’s journey doesn’t kick off on the supplier’s website. It starts on the factory floor with a production line bottleneck.
- Action: Mark Googles “improving manufacturing line efficiency” and starts digging into industry articles and forums.
- Thoughts: “Our output is slowing. Is it a process issue, or is the old equipment finally giving up? I need to find the root cause before I can even think about asking for a budget.”
- Emotions: Anxiety and pressure, mixed with a healthy dose of uncertainty.
- Touchpoints: Industry blogs, trade publications, and online forums where his peers hang out.
Consideration Stage:
After some research, Mark concludes that new machinery is the answer. Now, the real evaluation begins.
- Action: He searches for “industrial automation machinery,” downloads a few whitepapers, and watches demo videos from three different suppliers.
- Thoughts: “Supplier A has impressive case studies, but their pricing is a black box. Supplier B seems simpler to use, but will it integrate with our existing systems? I need to get all this into a comparison sheet for my director.”
- Emotions: He’s hopeful, but also a bit overwhelmed by the technical jargon and endless feature lists.
- Touchpoints: Supplier websites, G2 reviews, product demo videos, and downloadable spec sheets.
Decision Stage:
Mark has internal buy-in and is ready to pull the trigger.
- Action: He requests a formal quote and schedules a live demo for his team. He also pings the sales team with a last-minute question about post-sale support.
- Thoughts: “The demo was a success, and the team is on board. The price is right. I feel good about this choice.”
- Emotions: Confidence and relief. There’s a real sense of accomplishment now that a solution is in sight.
- Touchpoints: Demo request forms, sales calls, the pricing page, and the final checkout or contracting process.
That final step is crucial. A clunky, confusing checkout can introduce last-minute friction and doubt, even in B2B. In e-commerce, this is where over 70% of potential sales are lost. While B2B is different, the lesson holds true—a smooth final step is critical. To see just how vital this is, check out our guide on proven shopping cart abandonment solutions.
By mapping Mark’s journey this way, the supplier gets a crystal-clear view of his entire experience. They can see the questions he’s asking and feel the emotions he’s experiencing at every step. This living document becomes their playbook for creating more relevant content, refining sales tactics, and ultimately, delivering a far better customer experience.
Finding the Hidden Gaps and Opportunities

Alright, you’ve put in the work and have a complete B2B customer journey map laid out in front of you. What now? The real magic isn’t in having the map; it’s in using it. This visual story is a powerful diagnostic tool, and its true value comes from digging in to see exactly where your customer experience is falling apart and where you’re knocking it out of the park.
Think of it like an X-ray for your business. You’re looking for the fractures—those moments of friction and frustration that make potential customers walk away. But you’re also looking for the bright spots, the areas of strength you can build on. This analysis turns your map from a pretty picture into a concrete playbook for growth.
Start by zooming in on the negative emotions and pain points you’ve documented. Where did people feel confused, anxious, or just plain annoyed? These are your red flags. They signal a critical mismatch between what your customer needs and what your process is actually delivering.
Identifying Moments of Friction
Moments of friction are the potholes in your customer’s path. They can be small annoyances or massive, deal-killing roadblocks. Your map, filled with real customer feedback, will bring these issues to light with uncomfortable clarity. It’s where your perfectly planned marketing funnel springs a leak.
For instance, a software company I worked with uncovered a huge friction point on their pricing page. The map showed that prospects felt “overwhelmed” and “confused” at this exact touchpoint. A quick look at their web analytics confirmed it with a sky-high bounce rate. The pricing was loaded with jargon and too complex, killing all momentum right before the decision stage. That’s a classic journey gap.
Another all-too-common failure is a slow response to a high-intent action, like a demo request. A prospect is finally ready to talk, fills out your form, and then… crickets for 48 hours. By the time you respond, their urgency has vanished, and one of your competitors has already swooped in. Your map will show this as a sharp dip in emotion, moving from “hopeful” to “impatient.”
Key Insight: Look for spots on your map where customer emotion takes a nosedive. These emotional dips almost always point to a serious business problem, like lost leads, stalled deals, or future churn risks.
These insights are pure gold. They give you concrete, evidence-based places to start making improvements. No more guessing why leads aren’t converting; you have a clear, customer-validated reason.
Highlighting High-Performing Touchpoints
It’s just as important to find what’s working as it is to find what’s broken. Where on the map do customers feel confident, understood, and even delighted? These are your “moments of delight,” and they represent massive opportunities. You need to protect, amplify, and replicate these touchpoints.
Maybe your map reveals that a specific case study on your blog is a huge “aha!” moment. Prospects go from just being “curious” to being “convinced” after reading it. That isn’t just another piece of content; it’s a high-octane sales asset.
Once you know what your wins are, you can double down on them:
- Promote It: Make that case study impossible to miss on your website.
- Repurpose It: Turn it into a webinar, a short video, or a social media campaign.
- Train on It: Make sure your sales team knows how to use it to close deals.
This isn’t just about fixing problems; it’s about systematically scaling your successes.
Turning Insights into Action
Pinpointing these gaps and opportunities is only half the job. The next step is to get your entire team on board. The best way to do this is to run a workshop with key people from marketing, sales, and product.
Present the map and walk them through the journey, highlighting the key moments of friction and delight. This gets everyone on the same page and helps break down the internal silos that often hurt the customer experience. From there, you can brainstorm solutions and prioritize fixes based on their potential impact on revenue and customer retention.
The goal is to create a clear action plan. For example, if your checkout process is a point of friction, you’ll need a different set of solutions than if your onboarding is lacking. You can find some excellent ideas for smoothing out that final step in this guide on eCommerce checkout optimization; many of its principles apply directly to B2B scenarios as well.
Putting Your Journey Map to Work Across Teams
You’ve done the hard work. But a B2B customer journey map that just sits in a shared drive collecting digital dust is a monumental waste. It represents hours of research and analysis that, if left unused, provide zero value. The final, and arguably most important, step is to get that map off the page and into your company’s daily operations.
This isn’t about just sharing a file. It’s about fundamentally changing how your teams see their roles in the customer’s world. The map needs to become the single source of truth that aligns everyone—from marketing to sales to product and customer success—around a shared understanding of what your customers actually experience.
Assigning Clear Ownership Breaks Down Silos
The first move to make your map actionable is assigning clear, undeniable ownership for every single touchpoint. Cross-functional projects almost always fall apart due to a lack of accountability. When everyone is responsible, nobody is.
Your journey map is the perfect blueprint for this. Go through each stage and touchpoint and ask the simple question: “Who owns this interaction?”
- Marketing: They usually own the Awareness and early Consideration stages. This means the blog content, social media presence, online ads, and initial lead nurturing. Their mission is to attract and educate prospects based on the very questions and goals you identified in the map.
- Sales: They take the baton as a prospect moves from Consideration to Decision. This covers everything from the first discovery call and product demo to the proposal and negotiation. The map gives them invaluable context on what a prospect has already seen and what roadblocks they might hit.
- Product: While not always directly customer-facing, the Product team owns the actual user experience. The map should directly inform their roadmap by shining a light on user pain points and identifying features that create those crucial “aha!” moments.
- Customer Success/Support: They own the entire post-purchase journey. We’re talking onboarding, training, ongoing support, and renewal talks. They can use the map to design a proactive experience that anticipates needs and stops churn before it even starts.
Dividing up the labor like this creates real accountability. More importantly, it starts to break down the internal silos that are notorious for creating a clunky and disjointed customer experience.
The Journey Map in Action
When teams actually start using the map as their strategic guide, the results can be powerful. Suddenly, it’s not just about hitting internal KPIs; it’s about making the customer’s path smoother and more intuitive.
Example 1: Marketing Crafts Hyper-Relevant Content
Instead of just guessing, the marketing team looks at the map and sees that prospects in the “Consideration” stage are all asking, “How will this integrate with my existing tech stack?” So, they create a detailed integration guide and a short video tackling that exact pain point. This answers a real customer question at the exact moment they’re asking it.
Example 2: Sales Anticipates Objections
A salesperson checks the map before a demo call. They notice that customers at this stage often feel “anxious” about the implementation timeline. Instead of waiting to be asked, the rep proactively brings it up early in the call, which immediately builds trust and shows they get it.
Example 3: Customer Success Designs Proactive Onboarding
The journey map reveals that new customers often feel “overwhelmed” during their first week. Armed with this insight, the Customer Success team completely redesigns their onboarding. They create a “First Week Wins” checklist and set up a triggered SMS campaign to offer quick tips. Targeted communication like this can be a game-changer; the same principles used for abandoned cart recovery can be applied to re-engage users at any stage.
The real power of a B2B customer journey map is realized when it moves from being a document you look at to a tool you think with. It should guide daily decisions and shape every customer interaction.
Creating a Cadence for Review and Updates
Finally, remember that a customer journey map is not a “one and done” project. Your customers evolve, your market shifts, and your products change. Your map has to keep up.
Set up a regular time to review and update the map. A quarterly review is a great place to start. This meeting should bring together the owners from each team to discuss what’s changed on the ground.
During these reviews, ask the tough questions:
- Are our customers’ pain points still the same?
- Have new touchpoints emerged (like a new social platform or an AI chatbot)?
- Are our solutions actually improving the journey? What do the metrics say?
- What new feedback have we gathered from recent customer interviews or surveys?
This continuous feedback loop is what keeps your map from becoming outdated. It transforms the B2B customer journey map from a snapshot in time into a dynamic, strategic asset that drives real, customer-centric growth across your entire organization.
Common B2B Journey Mapping Questions

Even with a perfect plan in hand, actually building a B2B customer journey map always brings up a few tricky questions. Once you get down to the nitty-gritty, you’ll run into unique challenges and gray areas that theory just doesn’t cover.
This is where we get practical. Let’s tackle some of the most common hurdles I see teams face when they move from concept to execution. Think of this as your field guide for those “what do we do now?” moments.
Who Should Be Involved in Creating the Map?
The short answer? More people than you probably think. If your journey map is built entirely by the marketing team, it’s dead on arrival. Why? Because it will only ever show one piece of the puzzle—marketing’s piece.
Real, game-changing insights come from a room full of different perspectives. You need a cross-functional team.
Your core mapping crew should always include people from:
- Marketing: They understand the top-of-funnel, from awareness to initial consideration.
- Sales: They’re on the front lines, hearing objections and navigating the realities of prospect conversations every single day.
- Customer Success/Support: These folks know the post-purchase world inside and out, from onboarding friction to long-term pain points.
- Product: They can connect what customers are saying directly to the actual user experience.
Getting these teams in a room together does more than just build a map; it breaks down the silos that kill customer-centricity. The final product becomes a true, holistic view of the entire experience, not just a single, biased slice of it.
How Many Journey Maps Do We Need?
This is a fantastic question because it gets right to the heart of a common B2B pitfall. You almost never need just one map. The golden rule is to create a separate journey map for each of your distinct buyer personas.
Think about it. The journey of a CTO digging into your software’s API documentation is going to be wildly different from a CFO’s journey, who’s laser-focused on ROI and pricing models. Their goals, touchpoints, questions, and frustrations are completely unique.
A huge mistake I see companies make is trying to smash multiple personas into a single, generic map. All you get is a watered-down, confusing document that’s not actually useful for anyone.
Start with your most critical persona and build a dedicated map just for them. Get it right. Then, move on to the next. You might also find you need maps for different scenarios, like a new customer’s first 90 days versus an existing customer’s journey to upgrade their plan. Each path is distinct and deserves its own map.
How Often Should We Update Our Journey Map?
Your journey map should be a living, breathing document—not a “one-and-done” project that gathers dust on a server. Your market changes, your customers’ needs evolve, and your product gets updated. Your map has to keep up.
As a general rule, you should plan for a major review and update at least once a year. But honestly, that’s the bare minimum. You should be treating it as a much more dynamic tool.
- Quarterly Check-ins: Get the core team together for a quick meeting each quarter. What’s new? What customer behaviors have shifted? What new feedback have you heard?
- Trigger-Based Updates: Don’t wait for the quarterly meeting if something big happens. A major product launch, a change in your pricing structure, or entering a new market should all trigger an immediate map update.
The goal is to stop your map from becoming an outdated relic. When it’s regularly refreshed, it becomes a reliable strategic guide for the entire company—a true reflection of your customers’ current reality. This constant refinement is what turns a simple diagram into a powerful engine for growth.
Are you tired of seeing potential customers abandon their carts? CartBoss turns those lost opportunities into sales with powerful, automated SMS messages. Our tool helps you recover revenue effortlessly by re-engaging customers at the perfect moment, boosting conversions on autopilot. See how much more you could be selling at https://www.cartboss.io.