
Why Most Businesses Get Customer Retention Wrong
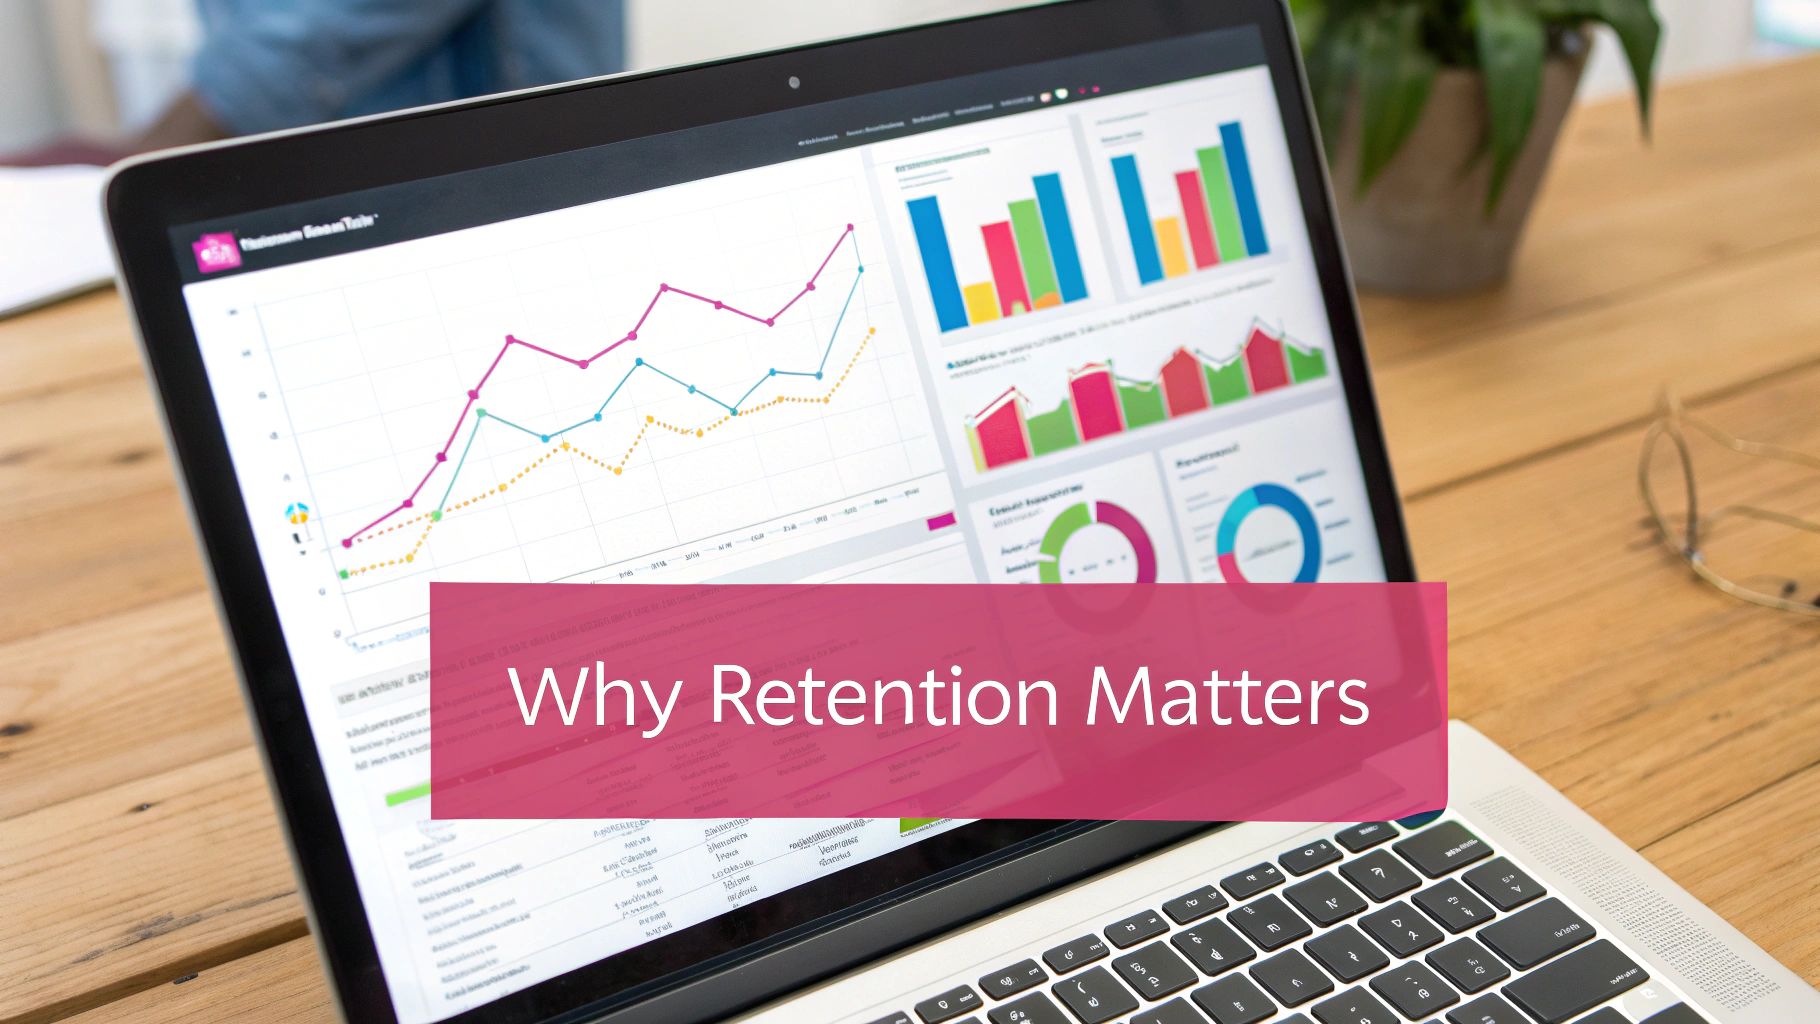
This screenshot from Wikipedia’s Customer Retention page visualizes the customer journey. It highlights how acquisition, retention, and profitability are all linked. The key takeaway? Retention isn’t something that just happens; it needs a proactive strategy.
I’ve seen firsthand how companies get tripped up by focusing on the wrong numbers. They’ll boast about huge customer counts, but then realize a big chunk are inactive or about to jump ship. They’re mistaking inertia for true loyalty. Just because someone hasn’t canceled their subscription doesn’t mean they’re actively choosing your business.
This is where things get interesting. Imagine two businesses with similar retention rates. One has mostly passive customers, the other has actively loyal customers. The first is much more vulnerable to competitors. This highlights why accurate customer retention calculation is so vital.
The Importance of Accurate Calculation
A precise calculation gives you the real picture of your customer base, revealing strengths and weaknesses. This knowledge can reshape everything from product development to marketing.
And let’s not forget the bottom line. Boosting retention by just 5% can increase profits by a whopping 25% to 95%, according to a Harvard Business Review study. This makes focusing on existing customers far more valuable than constantly chasing new ones, which is often more expensive and time-consuming.
Retention rates vary widely across industries. Think 75% in banking versus 38% in e-commerce. This emphasizes the need for strategies tailored to your specific industry. Want to dig deeper into these numbers? Learn more about customer retention statistics.
Looking for ways to boost your own numbers? This article on How to Increase Customer Retention is packed with practical tips. And if you’re looking to improve your communication strategy, you might find our guide on collecting phone numbers useful.
To help you benchmark your performance, I’ve put together a table comparing retention rates across different industries:
Industry Average Customer Retention Rates
Comparison of retention rates across different industries to help benchmark your business performance
| Industry | Average Retention Rate | Typical Challenges | Key Success Factors |
|---|---|---|---|
| Banking/Financial Services | 75% | Maintaining trust, competing with fintech disruptors | Personalized service, proactive communication, strong security measures |
| E-commerce/Retail | 38% | Intense competition, shifting consumer preferences, cart abandonment | Personalized recommendations, loyalty programs, seamless customer experience |
| SaaS/Subscription Services | Varies widely (often 60-90%) | Churn due to lack of value, competition | Ongoing customer engagement, continuous product improvement, excellent customer support |
| Media/Entertainment | Varies widely (subscription models crucial) | Content fatigue, competition from streaming services | Exclusive content, personalized recommendations, community building |
| Telecommunications | Varies, competition fierce | Price sensitivity, customer service issues | Bundled offerings, reliable service, proactive customer support |
This table highlights the variation in retention rates across industries. Notice how industries with high customer lifetime value, like banking, tend to have higher retention rates. This underscores the importance of understanding the dynamics of your specific industry and tailoring your retention strategies accordingly.
The Hidden Costs of Bad Retention Math
Let’s be honest, getting your customer retention calculation wrong is a bit like using a broken compass. You might think you’re on the right track, but you’re actually wandering aimlessly, burning through resources and losing out on golden opportunities. I’ve seen this firsthand with so many business owners. They invest heavily in acquiring new customers, only to discover their retention rate is so abysmal, they’re basically pouring money down the drain.
Imagine a subscription box company thrilled with a sudden influx of new subscribers. Everything looks rosy, right? But what if their retention calculations show most people cancel after the first box? That initial growth is worthless if they can’t keep those customers around. They could be overspending on fancy marketing and ignoring the customer experience – the real key to building loyalty.
The Danger of Cohort Confusion
Another common mistake is neglecting cohort analysis. A simple retention rate can hide significant issues within specific customer groups. Think of an e-commerce store with a decent overall retention rate. But digging deeper into their cohorts might reveal customers acquired through paid ads churn significantly faster than organic customers. This indicates their acquisition strategy is attracting the wrong kind of customers – a vital insight a basic customer retention calculation would completely miss. For more on calculating retention, check out this helpful resource: Customer Retention Rate Calculation.
When Healthy Businesses Look Sick
Even messing up the timing can skew your data. Calculating retention over the wrong time period can make a healthy business appear to be struggling. A seasonal business, for instance, might experience a natural dip in retention during the off-season. This is expected, but if they’re only analyzing month-over-month retention, they might needlessly panic. The trick is to choose time periods that match your business cycles and customer behavior.
Customer retention is a major hurdle for businesses everywhere, with real financial consequences. In the US alone, companies lose approximately $168 billion each year due to customer attrition. Industries like hospitality and travel struggle with particularly low retention rates, averaging about 55%, with a recent drop of 20% in 2024. Discover more insights on customer retention challenges. These costly errors emphasize why accurate retention calculations aren’t just a bonus – they’re crucial for sustained growth. Getting your numbers right can be the difference between flourishing and barely surviving.
The Customer Retention Calculation That Actually Works
Let’s talk about the math behind successful businesses – customer retention. Forget dry textbook formulas, we’re going to break down the customer retention rate calculation in a way that actually makes sense. We’ll cover the basics and then dive into the real-world scenarios that those textbooks tend to skip.
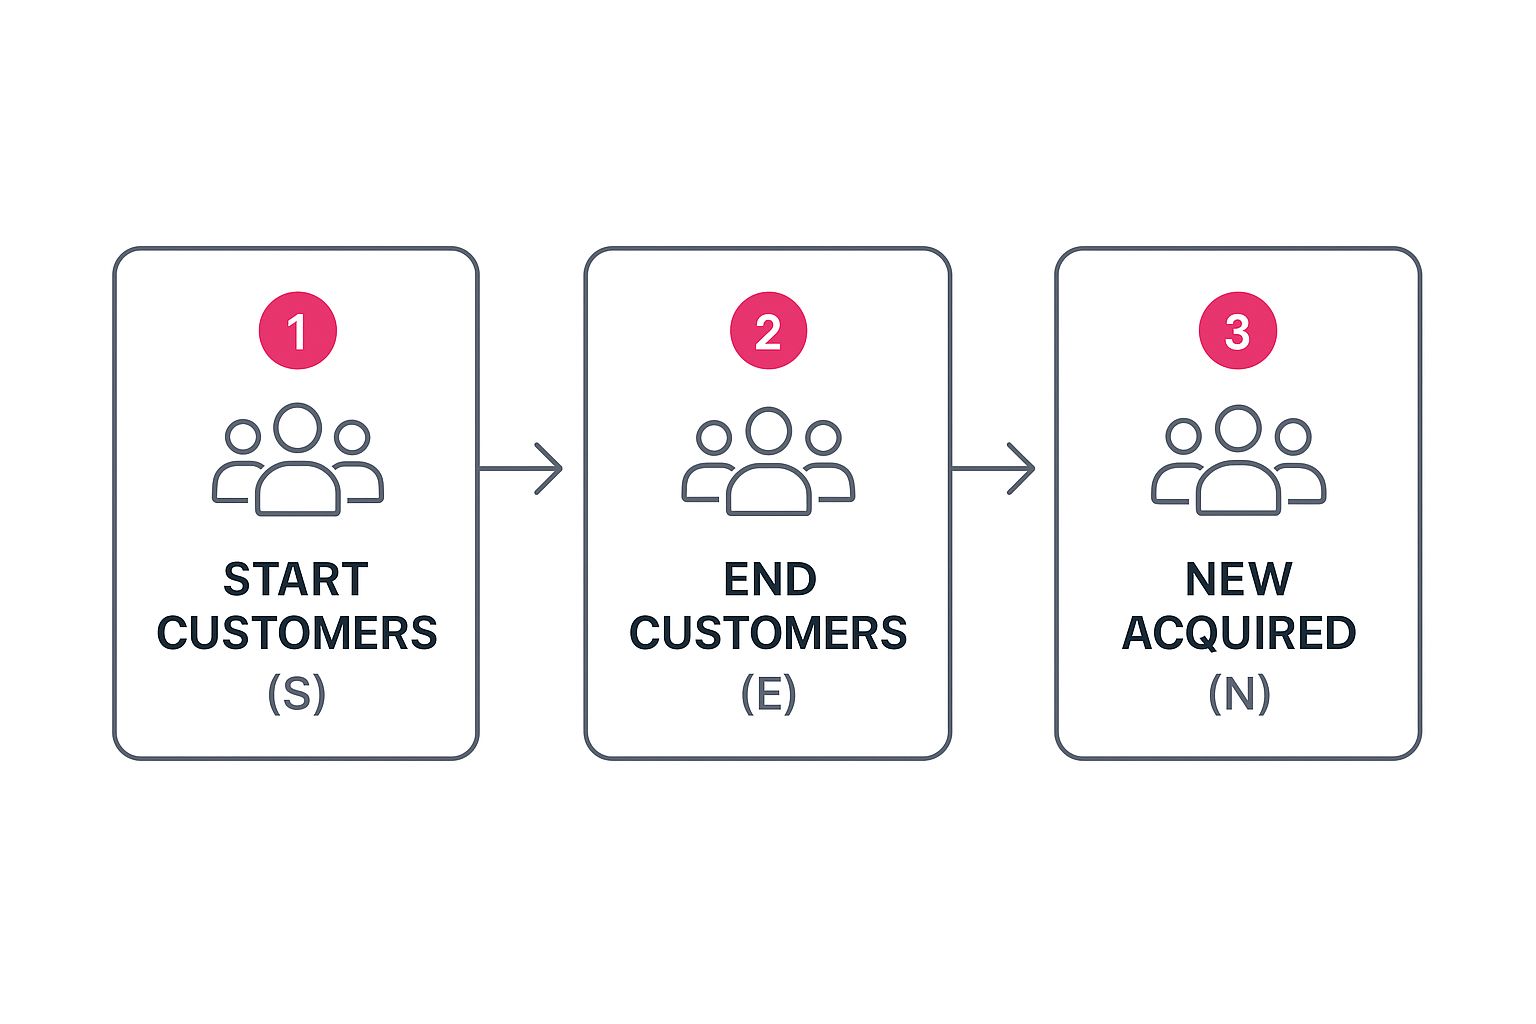
This infographic lays out the three key numbers you’ll need: starting customers (S), ending customers (E), and new customers acquired (N). Think of them as the ingredients for your retention rate recipe. Notice how it visually connects your starting and ending customer counts, highlighting the role new acquisitions play.
Mastering the Basic Formula
The core calculation is simpler than you might think: [(E - N) / S] * 100 = Customer Retention Rate. This formula zeroes in on the customers you kept from your initial group, leaving out any new additions. This gives you a clean percentage that reflects the stickiness of your customer base. For example, let’s say you began the year with 100 customers (S), finished with 120 (E), and gained 40 new customers (N) along the way. Your retention rate would be [(120-40)/100] * 100 = 80%.
Handling the Tricky Bits
Now, things get interesting. What happens when a customer leaves and then comes back? This is where defining your timeframe matters. Are you looking at monthly, quarterly, or annual retention? How you classify these “boomerang” customers depends on the timeframe. For a SaaS business, a monthly lens might see them as churned one month and a new acquisition the next. An annual perspective, though, might count them as retained, reflecting a longer-term engagement.
Seasonal businesses face another wrinkle. Think of a beach resort – retention naturally dips in the off-season. Comparing January’s retention to December’s wouldn’t be helpful. Instead, comparing this January to last January gives you a much clearer picture.
Subscription businesses with different billing cycles present their own set of challenges. Make sure your retention timeframe aligns with your billing cycles. Don’t compare monthly retention if you have customers on annual plans. Keep those apples with apples.
Practical Tips From the Trenches
Here’s a piece of advice I’ve learned firsthand: go beyond the basic retention rate. Slice and dice your customer data into meaningful groups. This could be by acquisition channel, product purchased, or any other factor that’s relevant to your business. This can uncover hidden churn patterns that a single overall rate would miss. For example, you might find that customers who come in through social media churn faster than those from organic search. That granular view tells you where to focus your improvement efforts.
Another crucial point: reliable data is everything. Bad data in, bad data out. Inaccurate customer counts or inconsistent tracking will torpedo your calculations. Invest the time to set up solid data collection. You won’t regret it. This might involve integrating your CRM with analytics tools or implementing automated tracking systems. Discover strategies to enhance your e-commerce performance.
Calculating customer retention isn’t just about numbers; it’s about understanding the health of your business. Done right, it’s a roadmap for sustainable growth.
Let’s take a look at a few examples to solidify these concepts. The table below illustrates how the customer retention rate calculation plays out in different scenarios.
Customer Retention Calculation Examples
| Business Type | Starting Customers | Ending Customers | New Customers | Retention Rate | Calculation Notes |
|---|---|---|---|---|---|
| SaaS Software | 500 | 600 | 200 | 80% | [(600-200)/500] * 100 = 80% |
| E-commerce Store | 1000 | 1100 | 300 | 80% | [(1100-300)/1000] * 100 = 80% |
| Local Coffee Shop | 200 | 220 | 50 | 85% | [(220-50)/200] * 100 = 85% |
As you can see, even with different starting customer bases and new customer acquisition rates, the retention rate provides a valuable, consistent metric for understanding how well a business is keeping its existing customers. This consistent metric allows you to benchmark your performance and identify areas for improvement.
Advanced Retention Metrics That Change Everything
So, you’ve nailed down the basic customer retention calculation. Awesome! But just like any seasoned cook knows, the basics are merely the foundation. Now it’s time to add the secret ingredients that truly elevate your retention recipe – the advanced metrics that can completely change how you understand your business.

This image shows how advanced retention metrics are all connected, each part contributing to a broader understanding of customer behavior. Think of it like piecing together a jigsaw puzzle; each metric is a vital piece of the overall picture.
Cohort-Based Retention: Unmasking Hidden Patterns
One of the most valuable tools for advanced retention analysis is cohort analysis. It’s like having a super-powered magnifying glass for your customer base. Instead of looking at a single overall retention rate, you divide your customers into groups (cohorts) based on when they first interacted with your business.
This lets you track how retention changes over time for specific customer groups. For instance, customers acquired in January might behave completely differently compared to those acquired in June. This insight helps identify which acquisition channels or marketing campaigns are attracting the most loyal customers.
Revenue Retention: The Story Beyond the Numbers
Basic customer retention focuses on customer numbers, but revenue retention digs deeper, revealing how much revenue you keep from existing customers. This metric is crucial for businesses with recurring revenue models like SaaS or subscription boxes.
A high customer retention rate might seem positive, but if those retained customers are downgrading subscriptions or spending less, your revenue retention could tell a different story. This metric clarifies not just who stays, but how much value they continue to provide.
Segmented Analysis: Exposing Hidden Problems
Sometimes, seemingly good overall averages can hide significant underlying problems. Segmented retention analysis allows you to dissect your customer data to uncover these hidden issues. You can segment by demographics, purchase history, product usage – whatever’s relevant to your business.
For example, an e-commerce store might discover that while overall retention is acceptable, customers from paid advertising churn much faster than organic customers. This highlights a potential weakness in their acquisition strategy.
Net Revenue Retention (NRR): The Growth Metric
Net Revenue Retention (NRR) builds on revenue retention by including expansion revenue – revenue from upsells, cross-sells, or upgrades from existing customers. A NRR above 100% means your existing customers are generating more revenue than before, a strong indicator of growth potential.
This metric is essential for SaaS businesses, as it demonstrates how effectively they’re monetizing their current customer base.
Lifetime Value Cohorts: Predicting Future Revenue
Finally, customer lifetime value (CLV) cohorts combine the power of cohort analysis with CLV calculations. This helps track the long-term value of various customer groups and forecast future revenue.
By understanding the CLV of different cohorts, you can make smarter decisions about where to invest your marketing and customer success efforts. You could even use CLV cohorts to personalize customer experiences and increase customer lifetime value.
By mastering these advanced retention metrics, you’ll gain a much deeper understanding of your customer behavior, identify your highest-value customer segments, and make data-driven decisions that drive sustainable growth. Choosing the most relevant metrics for your business is key. Some, like NRR, are particularly useful for subscription-based models, while others, like segmented analysis, benefit almost any business. Select the metrics that align with your specific objectives and resources, and use them to refine your customer retention strategies.
Choosing Time Periods That Actually Make Sense
Picking the right timeframe for your customer retention calculation is way more important than most people realize. Honestly, I’ve seen businesses get totally thrown off by looking at their data the wrong way. Different timeframes tell different stories. Daily data might show you quick engagement spikes, but annual data reveals long-term loyalty. So, how do you pick what works for you?
Aligning Timeframes With Your Business Model
First, think about how your timeframe matches your business model. If you run a subscription service, looking at retention monthly makes total sense—it lines up with your billing. But if you’re selling things like refrigerators, monthly data isn’t that helpful. You’d probably want to look at things yearly or even over a longer period. For businesses with less predictable sales, like a high-end furniture store, a fixed timeframe might not be ideal. Rolling averages could be your best friend here, smoothing out those ups and downs and giving you a clearer picture.
Accounting for Seasonality and Irregular Buying Patterns
Lots of businesses have seasonal swings. Think about an online swimsuit shop – they’ll naturally see higher retention in the summer. Comparing July’s retention to January’s just doesn’t work. Compare this July to last July instead. That way, you’re filtering out the seasonal ups and downs and seeing the true loyalty trends. If your sales are irregular, cohort analysis can be a lifesaver. Group customers who made their first purchase around the same time and watch what they do. This shows you how different groups interact with your brand over time, no matter when they first bought something. You might find some groups are much more valuable than others. Want to bump up those e-commerce sales? Take a look at our guide on boosting e-commerce sales.
Creating Actionable Time-Based Segments
The point isn’t just to have interesting data; it’s to do something with it. Set up time-based segments that help you understand how customer behavior changes. For example, split your customers into groups based on how long they’ve been with you: 0-6 months, 6-12 months, 12-24 months, and so on. Tracking retention within these groups can reveal valuable patterns. You might see a big retention drop after the first year, which tells you you need a plan to keep people engaged after that initial honeymoon period.
Communicating Time-Based Trends
Finally, communication is key. When you’re showing retention data to others, explain the timeframe you picked and why it matters. Use visuals like line graphs to show retention trends, so everyone can understand what the data is saying. Don’t just give them raw numbers. Context is everything. Clearly explain what those numbers mean for the business and what you suggest doing based on what you’ve learned. This turns your customer retention calculation from just a number into a tool that helps you make smart decisions.
Turning Retention Data Into Business Growth

This image perfectly captures how your customer retention calculations can fuel a cycle of growth. The insights you gain directly inform your strategies for a better customer experience, creating a positive feedback loop that boosts retention and, ultimately, your bottom line.
Calculating your retention rate is an important first step, but the real value lies in turning those numbers into actionable improvements. Truly successful companies don’t just track retention – they use it as a guiding principle for everything they do, from developing new products to deciding where to invest their marketing budget.
Identifying Your VIP Customers
Retention data is a goldmine for identifying your most valuable customer segments. These aren’t just your loyal customers; they’re the ones who stick around and drive the most revenue. Knowing who they are allows you to focus your energy on keeping them happy and engaged.
For example, you might find that customers who buy a particular product have much higher retention rates. This could inspire targeted marketing campaigns for related products or exclusive offers just for that group. Another effective strategy is to cultivate stronger relationships with these high-value customers. Think personalized onboarding, proactive support, or even early access to new features. Building a robust customer retention strategy is crucial for improving your bottom line. For more on this, check out this helpful resource: Customer Retention Strategy.
Prioritizing Retention Efforts for Maximum Impact
Not every retention strategy yields the same results. Some will give you a much bigger bang for your buck. This is where your retention data becomes incredibly powerful. It helps you prioritize where to invest your resources for the biggest impact.
Let’s say you discover that personalized onboarding significantly improves new customer retention. This might lead you to shift resources from less effective initiatives and expand your onboarding program. This focused approach ensures you’re getting the most out of your retention efforts by concentrating on what truly moves the needle.
Case Studies: Retention in Action
Let me share a few real-world examples. I’ve seen firsthand how retention analysis can dramatically reduce churn, boosting customer lifetime value and leading to more predictable revenue streams. One SaaS company noticed that a large chunk of their churn happened within the first month of a subscription. They focused on improving their onboarding and saw a huge drop in early churn. Another e-commerce business found that their loyalty program members had much higher retention rates and bought more frequently. They invested in making their loyalty program even better with more personalized rewards and exclusive perks. The result? A substantial increase in customer lifetime value. Loyalty programs and positive customer experiences are essential for retention. In fact, 59% of e-commerce businesses now prioritize customer retention. Retail businesses have an average retention rate of 63%, highlighting the effectiveness of strategies like loyalty programs and personalized experiences. Want to dive deeper into the numbers? Discover more insights on customer retention statistics.
Setting Realistic Retention Targets and Measuring ROI
It’s important to set achievable retention targets based on your industry, business model, and past performance. Your data can also help you measure the actual return on investment of your retention programs. By tracking how specific initiatives impact your retention rates and revenue, you can prove the value of your efforts to stakeholders and get support for future investments. Using retention data for business growth isn’t just about analyzing numbers; it’s about truly understanding your customers, focusing your efforts, and making smart choices that create lasting loyalty and drive sustainable growth.
Your Customer Retention Calculation Action Plan
Now that we understand why nailing your customer retention calculation is so crucial, and we’ve seen how things can go sideways, let’s map out a plan you can put into action right away. Think of this as your roadmap, from setting up reliable data tracking to building dashboards you’ll actually use.
Building a Solid Data Foundation
First things first: you need a solid data foundation. Think of it like building a house – a shaky foundation leads to a shaky house. In our world, bad data leads to bad decisions. This means integrating tools like your CRM with analytics platforms, or setting up automated tracking.
What data do you actually need? Are you tracking subscription renewals, repeat purchases, or something else entirely? This really depends on your business. An e-commerce store might track purchase history and website visits, while a SaaS company might track login frequency and feature usage. Different strokes for different folks.
- Identify Key Data Points: Figure out the metrics that truly matter for your business and reflect customer behavior.
- Choose the Right Tools: Pick tools that play nicely with your current setup. Seamless integration is key.
- Automate Data Collection: Ditch the manual data entry! It saves time and reduces errors.
Creating Dashboards That Drive Decisions
Next up: build dashboards that bring your retention data to life. These shouldn’t be static reports that collect dust. Use tools that let you slice and dice your data – by customer segments, time periods, or even specific customer characteristics.
Imagine a dashboard showing retention by acquisition channel. Boom! Instant insight into which channels are bringing in your most loyal customers. That’s the power of visualization.
- Visualize Key Metrics: Highlight the most important retention metrics. Make them front and center.
- Segment Your Data: Create dynamic dashboards that let you dig deeper into specific customer groups.
- Regularly Review and Analyze: Set a regular schedule for checking your dashboards and spotting trends. For example, are abandoned carts a problem? Check out this article on How to Reduce Cart Abandonment.
Communicating Retention Insights Effectively
Crunching the numbers is only half the battle. You need to communicate your findings clearly. Use visuals – line graphs are great for showing trends over time. Explain the timeframes you’re using and why they’re relevant.
Don’t just throw raw numbers around. Explain what they mean. What actions do you recommend based on these insights? For example, if social media acquisitions have low retention, maybe you need to rethink your social media targeting.
- Tailor Your Message: Speak the language of your audience. Executives? Marketing team? Tailor your message accordingly.
- Use Visuals: Charts and graphs make data digestible. A picture is worth a thousand words, right?
- Focus on Actionable Insights: Don’t just present data – offer solutions. Consider using an AI retention bot to proactively address churn and optimize growth.
Implementing and Refining Your Strategy
Retention isn’t a one-and-done deal. It’s an ongoing process. You need to constantly refine your strategy based on what you learn. Implement changes, measure the impact, and adjust your approach as needed. This constant tweaking is what separates the good from the great.
Let’s say you launch a new onboarding program. Track its effect on retention over time. Not seeing the results you expected? Be ready to adjust the program or try a different approach. Flexibility is key.
By following this action plan, you can turn your customer retention calculation from a simple number into a powerful engine for growth and building long-term customer loyalty. Want to turn those abandoned carts into sales? Check out CartBoss and see how SMS can boost your sales – they claim up to 50%!