
In the fast-paced world of online retail, data is your most valuable asset. But with countless data points available, it’s easy to get lost in a sea of numbers that don’t drive meaningful action. The key isn’t to track everything; it’s to track what truly matters. This guide cuts through the noise to focus on the essential ecommerce metrics to track for not just survival, but explosive growth in 2025. We’ll move beyond surface-level vanity metrics and dive deep into the numbers that reveal the health, profitability, and future potential of your business.
From understanding customer behavior to optimizing your ad spend, mastering these ten metrics provides a clear, actionable roadmap to scale your operations and enhance customer loyalty. While these KPIs are specific to ecommerce, they fit within a larger framework of business health. For a broader understanding of how to drive your business’s overall success, explore these 8 essential business performance indicators for 2025. By connecting your store’s performance to wider business goals, you create a more resilient strategy.
This article will break down each metric with clear definitions, simple formulas, and actionable steps to improve them. Let’s transform your data from a confusing jumble into a powerful tool for strategic decision-making and significantly boost your bottom line.
1. Conversion Rate
Conversion Rate is arguably the most critical of all ecommerce metrics to track. It represents the percentage of your website visitors who complete a desired action, most commonly making a purchase. A high conversion rate indicates effective marketing, compelling product offerings, and a seamless user experience.
How to Calculate and Use It
Calculating this metric is straightforward:
Conversion Rate = (Total Number of Conversions / Total Number of Visitors) x 100
For example, if your store had 5,000 visitors and 100 sales in a month, your conversion rate would be 2%. While a 2-3% rate is a common industry benchmark, this figure can vary significantly by niche and traffic source. The real power of this metric comes from tracking it over time to measure the impact of site changes, new marketing campaigns, or pricing adjustments.
Key Insight: Don’t just track your overall conversion rate. Segment it by traffic source, device type, and customer demographics to uncover specific areas for improvement.
The following bar chart illustrates how conversion rates can differ significantly across various devices.
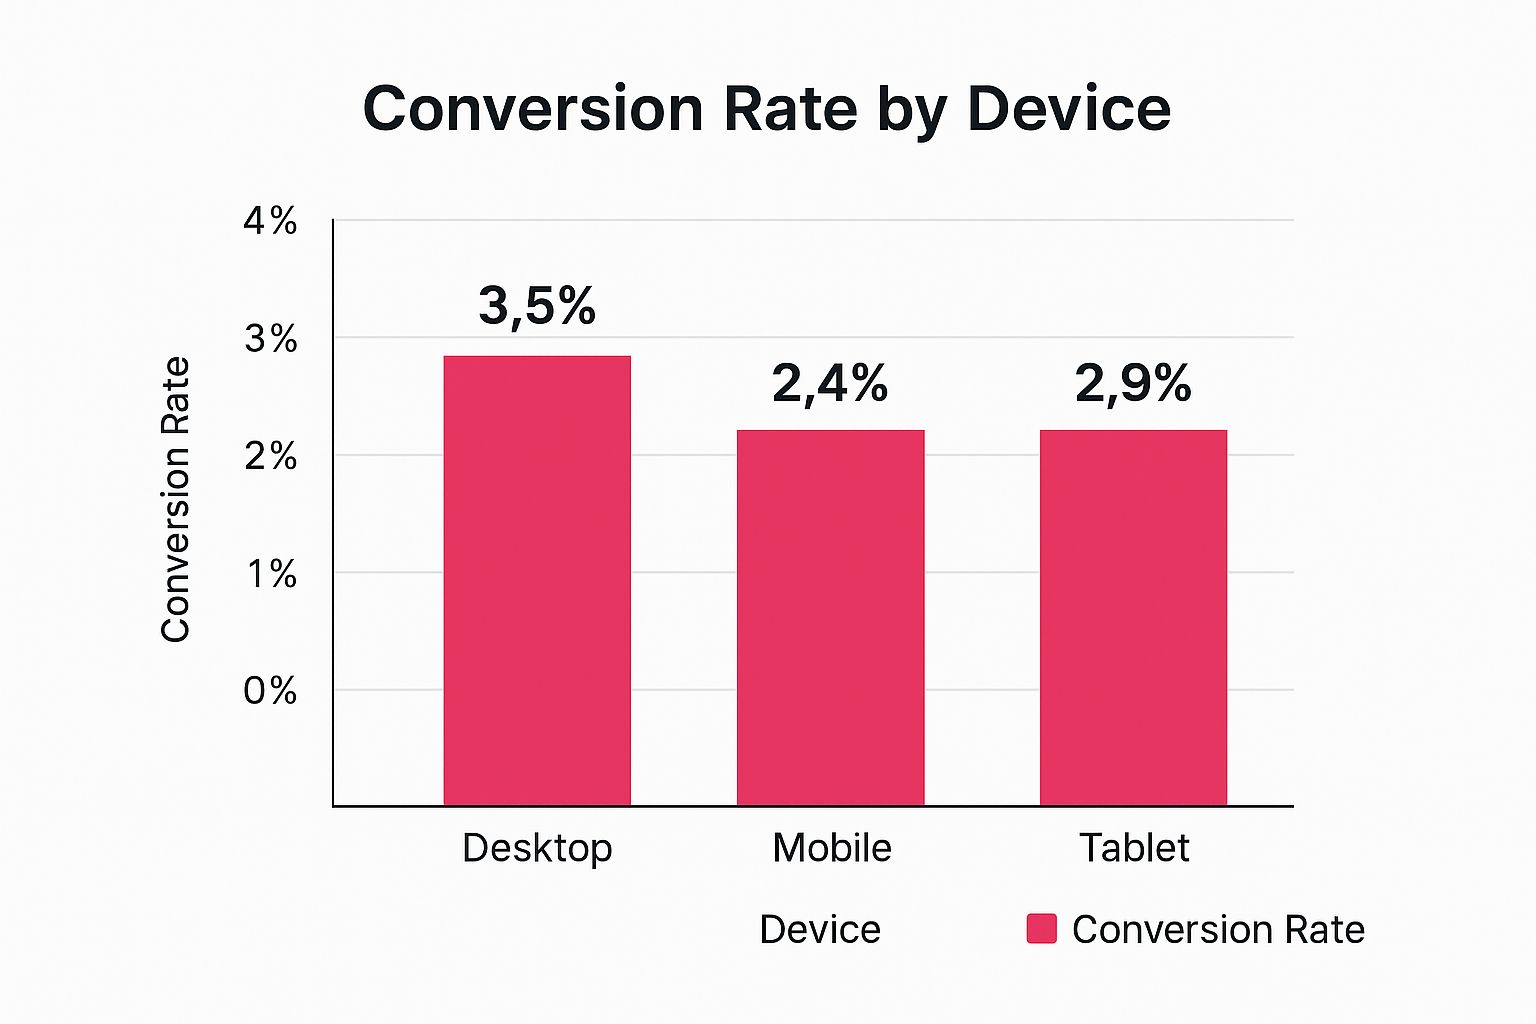
The chart clearly shows that while mobile traffic is high, desktop users convert at a much higher rate, highlighting a crucial optimization opportunity. By focusing on improving the mobile checkout process, you can directly address this gap and lift your overall conversion numbers. For a deeper dive into boosting this metric, learn more about the ultimate guide to ecommerce conversion rate optimization.
2. Customer Acquisition Cost (CAC)
Customer Acquisition Cost, or CAC, is one of the most vital ecommerce metrics to track for understanding business profitability and sustainability. It represents the total average cost your company spends to gain a new customer. A low CAC signifies efficient marketing and sales operations, allowing your brand to scale profitably.
How to Calculate and Use It
Calculating this metric is a foundational step for financial planning:
CAC = Total Marketing & Sales Costs / Number of New Customers Acquired
For instance, if you spent $10,000 on marketing and sales in a quarter and acquired 500 new customers, your CAC would be $20. The real power of this metric is unlocked when you compare it against your Customer Lifetime Value (LTV). A healthy business model requires an LTV significantly higher than its CAC. Tracking this allows you to assess campaign performance and make informed decisions about budget allocation.
Key Insight: Don’t just calculate a blended CAC. Track it by individual marketing channels (e.g., Google Ads, Facebook, content marketing) to identify your most profitable sources of new customers and eliminate wasteful spending.
This granular approach helps you understand which channels bring in high-value customers for the lowest cost. For example, Dollar Shave Club famously achieved a low CAC through viral video marketing, while Casper reduced its acquisition costs by 40% using a referral program. By identifying your most efficient channels, you can double down on what works. To better understand the nuances of this crucial metric, you can learn more about how to calculate and optimize your Customer Acquisition Cost.
3. Customer Lifetime Value (CLV/LTV)
Customer Lifetime Value (CLV or LTV) is a crucial predictive metric that shifts your focus from single transactions to long-term profitability. It represents the total net profit your company can expect to make from any given customer throughout their entire relationship with your brand. Understanding CLV is essential for making informed decisions on marketing spend, customer acquisition, and retention strategies.
How to Calculate and Use It
A simple way to calculate this metric is:
CLV = Average Order Value x Average Purchase Frequency x Average Customer Lifespan
For instance, if your average customer spends $50 per order, buys 3 times a year, and stays with you for 2 years, their CLV would be $300. This figure tells you precisely how much you can afford to spend to acquire a similar customer while remaining profitable. Companies like Starbucks use this metric to justify loyalty programs, knowing their average customer’s CLV is over $14,000.
Key Insight: Segment your CLV by the original acquisition channel. You may find that customers from organic search have a much higher lifetime value than those acquired through paid ads, allowing you to reallocate your marketing budget more effectively.
Tracking CLV helps prioritize high-value customer segments and informs which retention efforts will yield the highest return on investment. Focusing on increasing purchase frequency or average order value for existing customers is often a more cost-effective growth lever than constantly acquiring new ones.
4. Cart Abandonment Rate
Cart Abandonment Rate (CAR) is one of the most revealing ecommerce metrics to track, pinpointing the exact moment a potential customer decides not to buy. It represents the percentage of shopping carts initiated but not completed. A high CAR often signals friction in your checkout process, unexpected costs, or a lack of trust, making it a goldmine for optimization opportunities.
How to Calculate and Use It
Understanding your CAR is the first step toward fixing the leaks in your sales funnel. The calculation is simple:
CAR = (1 – (Total Completed Purchases / Total Carts Created)) x 100
For instance, if 1,000 carts were created and only 300 resulted in a sale, your CAR would be 70%. While the Baymard Institute reports an average rate of nearly 70%, even small improvements can significantly boost revenue. For example, Target successfully recovered 15% of its abandoned carts using targeted email campaigns. Similarly, ASOS cut its abandonment rate by 50% simply by introducing a guest checkout option.
Key Insight: Don’t view abandoned carts as lost sales; see them as a list of highly interested leads. Focus on simplifying the path to purchase by implementing strategies like one-click payments and displaying trust signals prominently.
For a visual guide on tackling this common ecommerce challenge, the video below offers practical tips to reduce cart abandonment.
To start recovering revenue, consider sending abandoned cart emails within 1-3 hours and implementing exit-intent popups with a small incentive. Each recovered cart is a direct addition to your bottom line, making this one of the most impactful ecommerce metrics to track.
5. Average Order Value (AOV)
Average Order Value (AOV) is one of the most powerful ecommerce metrics to track because it reveals how much customers typically spend in a single transaction. Increasing your AOV is a direct path to boosting revenue without needing to acquire new customers, making it a highly efficient growth lever. It helps you understand customer purchasing habits and the effectiveness of your pricing and upselling strategies.

How to Calculate and Use It
The formula for AOV is simple, yet its implications are profound:
Average Order Value = Total Revenue / Total Number of Orders
For example, if your store generated $20,000 in revenue from 400 separate orders, your AOV would be $50. The goal is to consistently increase this number. For instance, Amazon famously boosted its AOV by implementing its “Frequently Bought Together” recommendations, while Sephora uses product samples to encourage larger purchases.
Key Insight: Don’t just calculate your overall AOV. Segment it by marketing channel or campaign to see which sources bring in your highest-spending customers, then double down on those channels.
By strategically implementing tactics like product bundling, volume discounts, or offering free shipping on orders above your current AOV, you can effectively encourage customers to add more to their carts. For a comprehensive look at these tactics, you can discover more about how to increase average order value.
6. Return on Ad Spend (ROAS)
Return on Ad Spend (ROAS) is a vital metric that measures the revenue your business generates for every dollar spent on advertising. While metrics like conversion rate tell you if your site is effective, ROAS tells you if your marketing spend is profitable, making it one of the most important ecommerce metrics to track for sustainable growth. It directly ties marketing efforts to revenue, helping you identify which campaigns are winners and which are draining your budget.
How to Calculate and Use It
The calculation for ROAS is fundamental for any paid advertising strategy:
ROAS = (Revenue from Advertising / Total Advertising Cost)
For example, if you spend $1,000 on a Google Ads campaign and it generates $5,000 in sales, your ROAS is 5:1. This means you earned $5 for every $1 spent. This metric is essential for evaluating campaign effectiveness and optimizing budget allocation. Brands like Purple Mattress have achieved a 15:1 ROAS with targeted YouTube ads, proving the power of a well-executed strategy.
Key Insight: Don’t just aim for a high ROAS; aim for a profitable one. Your target ROAS must exceed your product’s break-even point. Calculate your profit margin to set a minimum ROAS threshold that ensures every ad dollar spent is actually contributing to your bottom line.
By monitoring ROAS across different channels, such as social media versus search ads, you can strategically shift your budget to the most profitable platforms. This data-driven approach moves you from spending money to investing it intelligently. For a more comprehensive look at this crucial metric, you can learn more about how to calculate ROAS for your business.
7. Customer Retention Rate
While acquiring new customers is essential, retaining existing ones is far more cost-effective and a strong indicator of long-term business health. Customer Retention Rate measures the percentage of customers who continue to make purchases over a specific period. A high retention rate signals strong customer satisfaction, brand loyalty, and the sustainability of your business model.
How to Calculate and Use It
Calculating this key ecommerce metric is done with a specific formula:
CRR = [ (Customers at End of Period – New Customers Acquired) / Customers at Start of Period ] x 100
For example, if you started the quarter with 1,000 customers, gained 200 new ones, and ended with 1,100 total customers, your CRR would be 90%. Tracking this metric allows you to gauge the effectiveness of your loyalty programs, customer service, and overall post-purchase experience. Companies like Amazon Prime (93% annual retention) and Costco (90% renewal) demonstrate the power of high retention.
Key Insight: Retention is cheaper than acquisition. A small 5% increase in customer retention can lead to a profit increase of 25% to 95%.
Focusing on retention builds a stable revenue base and creates brand advocates. To further optimize your customer retention efforts and understand strategies for long-term customer relationships, explore these proven ways to reduce customer churn. Improving this metric requires a proactive approach, including personalized experiences and excellent support. For a more detailed breakdown, you can learn more about using a Customer Retention Rate calculator for business growth.
8. Revenue Per Visitor (RPV)
Revenue Per Visitor (RPV) offers a holistic view of your store’s financial performance by measuring the average amount of money generated by each person who visits your site, regardless of whether they complete a purchase. This powerful metric effectively combines your conversion rate and Average Order Value, providing a clearer picture of overall profitability than either metric can alone. Among all ecommerce metrics to track, RPV helps you understand the true value of your traffic.
How to Calculate and Use It
Calculating RPV is simple and reveals the direct monetary worth of each visitor:
Revenue Per Visitor = Total Revenue / Total Number of Unique Visitors
For instance, if your store generated $10,000 in revenue from 5,000 unique visitors, your RPV would be $2.00. Benchmarks vary widely; while a Shopify Plus merchant might average $2.50, fashion sites often see $0.50-$1.50, and luxury brands can achieve $5.00 or more. The real utility of RPV is in evaluating the quality of your traffic and the effectiveness of your on-site experience.
Key Insight: Use RPV to make smarter marketing budget decisions. If you know the RPV from a specific ad campaign is $3.00, you can confidently spend up to that amount per click to acquire a visitor and remain profitable.
By tracking RPV, you can stop focusing on just driving more traffic and start focusing on attracting higher-value traffic. Optimizing for both conversions and cart size simultaneously allows you to increase the value of every single visit, making it a crucial lever for sustainable growth.
9. Net Promoter Score (NPS)
Net Promoter Score (NPS) is a powerful metric that goes beyond simple transaction data to measure customer loyalty and satisfaction. It gauges how likely your customers are to recommend your brand, products, or services to others, providing a direct indicator of brand health and potential for organic growth.
How to Calculate and Use It
Calculating NPS begins with a single question: “On a scale of 0-10, how likely are you to recommend our company to a friend or colleague?” Based on their response, customers are categorized as:
- Promoters (9-10): Loyal enthusiasts who will keep buying and fuel growth.
- Passives (7-8): Satisfied but unenthusiastic customers who are vulnerable to competitors.
- Detractors (0-6): Unhappy customers who can damage your brand through negative word-of-mouth.
The formula is:
NPS = % of Promoters – % of Detractors
For instance, if 50% of your respondents are Promoters and 10% are Detractors, your NPS is 40. Tracking this metric helps you understand the overall sentiment of your customer base and prioritize efforts to improve the customer experience. Following up with Detractors to resolve their issues is a critical step in using this metric effectively.
Key Insight: Don’t focus solely on the absolute NPS score. Track the trend over time and analyze the qualitative feedback from Detractors and Promoters to uncover specific drivers of loyalty and dissatisfaction.
10. Inventory Turnover Rate
Inventory Turnover Rate is a crucial efficiency metric that reveals how many times your company sells and replaces its stock over a specific period. A high turnover rate indicates strong sales and effective inventory management, while a low rate can signal overstocking, poor sales, or obsolete products, tying up valuable working capital. This is one of the most important ecommerce metrics to track for maintaining a healthy cash flow.
How to Calculate and Use It
The formula for calculating this metric is as follows:
Inventory Turnover Rate = Cost of Goods Sold (COGS) / Average Inventory Value
For example, if your annual COGS is $200,000 and your average inventory value is $40,000, your turnover rate is 5. This means you sold through your entire inventory five times that year. Giants like Zara achieve over 12 turns annually through fast fashion, while Walmart maintains a rate of 8-9 with its hyper-efficient supply chain. Tracking this helps you optimize purchasing and avoid costly stockouts or overstocks.
Key Insight: Don’t settle for a single, company-wide turnover rate. Segment this metric by product category or even individual SKUs to identify your fastest and slowest-moving items, allowing for much more precise inventory management.
By monitoring this rate, you can make smarter decisions about your product mix, promotions, and purchasing cycles. For instance, using ABC analysis to prioritize high-turnover (A-grade) items ensures your best-sellers are always in stock. Regularly clearing out slow-moving (C-grade) inventory frees up capital and warehouse space for more profitable products, directly improving your bottom line.
Key Ecommerce Metrics Comparison
| Metric | 🔄 Implementation Complexity | 🛠️ Resource Requirements | 📊 Expected Outcomes | 💡 Ideal Use Cases | ⭐ Key Advantages |
|---|---|---|---|---|---|
| Conversion Rate | Low — easy to track via analytics | Moderate — needs traffic and conversion tracking | Measures effectiveness of website in converting visitors | Ecommerce sites, A/B testing, CRO | Simple, directly linked to revenue growth |
| Customer Acquisition Cost (CAC) | Moderate — requires cost attribution | High — needs detailed marketing & sales cost data | Understands cost efficiency of acquiring customers | Budget optimization, ROI analysis, funding | Identifies cost-effective acquisition channels |
| Customer Lifetime Value (CLV) | High — predictive modeling needed | High — needs historical purchase & retention data | Measures long-term revenue potential per customer | Retention strategies, segmentation, budgeting | Guides acquisition & retention spend |
| Cart Abandonment Rate | Low — track cart and checkout data | Moderate — tracking and recovery mechanisms | Identifies revenue leakage points in checkout process | Checkout optimization, remarketing campaigns | Highlights quick-win revenue recovery opportunities |
| Average Order Value (AOV) | Low — revenue and order tracking | Low — transactional data required | Shows average spend per transaction, informs pricing | Pricing strategy, upselling, bundling | Direct revenue impact without increasing traffic |
| Return on Ad Spend (ROAS) | Moderate — needs attribution setup | High — tracking costs and revenue by campaign | Measures advertising revenue efficiency | Ad campaign management, budget allocation | Directly measures ad effectiveness |
| Customer Retention Rate | Moderate — cohort analysis needed | Moderate — customer tracking over time | Indicates customer loyalty and satisfaction | Loyalty programs, subscription models | Predictive of business sustainability |
| Revenue Per Visitor (RPV) | Low — combines revenue and traffic | Moderate — needs comprehensive data | Combines conversion rate and AOV to evaluate site performance | Traffic quality evaluation, marketing strategy | Comprehensive view of visitor revenue impact |
| Net Promoter Score (NPS) | Low — survey implementation | Low — survey distribution and analysis | Measures customer loyalty and satisfaction | Customer experience management, benchmarking | Simple, strong predictor of growth |
| Inventory Turnover Rate | Moderate — requires inventory & COGS data | Moderate — inventory tracking systems | Indicates efficiency of inventory management | Retail, supply chain, purchasing decisions | Helps optimize cash flow and reduce obsolete stock |
From Data to Dollars: Putting Your Metrics to Work
We’ve journeyed through the ten essential ecommerce metrics to track, moving from foundational concepts like Conversion Rate to the strategic pillars of Customer Lifetime Value (CLV) and Customer Acquisition Cost (CAC). We have explored how to calculate them, what benchmarks to aim for, and, most importantly, how they interconnect. But understanding these individual numbers is only the beginning. The true power isn’t in the data itself; it’s in the story the data tells and the decisive actions you take based on that narrative.
Think of your metrics dashboard not as a report card, but as a dynamic roadmap. Each metric is a signpost pointing toward opportunities for growth and potential roadblocks to avoid. A declining Average Order Value (AOV), for instance, is not just a number; it’s a signal to implement strategic upselling, cross-selling, or product bundling initiatives. Similarly, a low Customer Retention Rate is a direct call to action to invest more in loyalty programs, post-purchase communication, and exceptional customer service.
Weaving Your Metrics into a Cohesive Strategy
The most successful ecommerce brands don’t just monitor these KPIs in isolation. They build a cohesive feedback loop where insights from one area inform actions in another.
- Connecting the Dots: A high CAC is far less concerning when your CLV is multiples higher. A low Return on Ad Spend (ROAS) might be acceptable for campaigns designed to acquire high-CLV customers. By analyzing how these metrics influence each other, you can make smarter, more holistic business decisions.
- From Insight to Action: Don’t let your data gather digital dust. If you identify a high Cart Abandonment Rate, your immediate next step should be to diagnose the cause. Is it unexpected shipping costs? A complicated checkout form? A lack of payment options? Use this insight to run A/B tests and implement targeted improvements.
- Automate for Impact: Once you identify a key problem area, leverage technology to solve it at scale. For example, if cart abandonment is your primary revenue leak, implementing an automated recovery system is a non-negotiable next step.
Your Path Forward: Act, Measure, Repeat
Mastering the ecommerce metrics to track is an ongoing process of refinement. The goal is to create a rhythm within your business: track your data, analyze the trends, implement strategic changes, and then measure the impact of those changes. This iterative cycle transforms raw numbers into tangible revenue and sustainable growth.
The data is waiting on your dashboard. It holds the answers to your most pressing questions about customer behavior, marketing efficiency, and operational health. By embracing this data-driven mindset, you move from simply running an online store to strategically engineering a profitable, resilient, and customer-centric ecommerce powerhouse. The insights are there; it’s time to put them to work and turn your data into dollars.
Ready to take immediate action on one of your most critical metrics? If your Cart Abandonment Rate is higher than you’d like, CartBoss can help you recover that lost revenue instantly. Our automated SMS cart recovery campaigns re-engage shoppers at the perfect moment, turning abandoned carts into completed sales. See how much revenue you can recover today at CartBoss.