
A return on ad spend calculator is a dead-simple tool that shows you how much money you’re making for every single dollar you pump into advertising. It’s the fastest way to know if your campaigns are actually profitable or just an expensive hobby.
What Is ROAS and Why Does It Matter?

Imagine your ad budget is the fuel for your business’s growth engine. Return on Ad Spend (ROAS) is the gauge on your dashboard telling you how efficiently that fuel is being burned. It helps you ignore vanity metrics like clicks and impressions to focus on the one thing that really matters: making money.
In plain English, ROAS answers one critical question: “For every dollar I spend on ads, how many dollars do I get back?” Getting a clear answer to this is essential for making smart decisions that turn advertising from a gamble into a predictable source of growth.
The Core Concept of ROAS
At its core, Return on Ad Spend (ROAS) is a straightforward metric that measures the revenue you generate for every dollar you spend on advertising. The formula is as simple as it gets: divide your total revenue from a campaign by your total ad spend.
For example, if you spend $100 on a campaign and it brings in $200 in sales, your ROAS is 2.0x. That means you earned $2 for every $1 you invested. You can find more great insights about this key metric over at Adonis Media.
This simple number gives you a direct look at the financial health of your campaign. It’s the key to figuring out which channels, campaigns, and even specific ads are pulling their weight.
Why ROAS Is a Critical Metric
For any business that’s serious about growth, tracking ROAS isn’t optional. Without it, you’re basically flying blind—throwing money at campaigns and just hoping for the best.
Here’s why it’s so important:
- Profitability Measurement: ROAS gives you a clear, honest look at which marketing efforts are making you money and which are just burning through your budget.
- Smarter Budget Allocation: Once you know which campaigns are winners, you can confidently double down on what’s working and cut the dead weight.
- Data-Backed Decisions: It gives marketers the hard data needed to justify ad spend and make strategic tweaks to improve performance over time.
A solid understanding of ROAS lets you shift from just spending on ads to investing in measurable growth. It’s the difference between guessing and knowing.
At the end of the day, using a return on ad spend calculator isn’t just about crunching numbers. It’s about getting the strategic insight you need to scale your business and make sure every dollar spent is working hard for your bottom line.
How To Calculate Your Return On Ad Spend
Figuring out your Return on Ad Spend doesn’t involve any crazy spreadsheets or high-level math. It’s actually a dead-simple formula that cuts right to the chase: are your ads making you money? The whole idea is to stack up the cash you spent against the cash your ads brought in.
The formula itself is as straightforward as it gets:
ROAS = Total Revenue from Ads / Total Ad Spend
Let’s put it into practice. Say you dropped $1,000 on a Google Ads campaign, and that campaign pulled in $5,000 in sales. You’d just divide $5,000 by $1,000, which gives you a ROAS of 5x, or 500%. Simple as that. For every single dollar you put in, you got five dollars back. A return on ad spend calculator can do the math for you, but knowing what numbers to plug in is where the real magic happens.
This image lays out the basic, three-step journey to finding your ROAS.
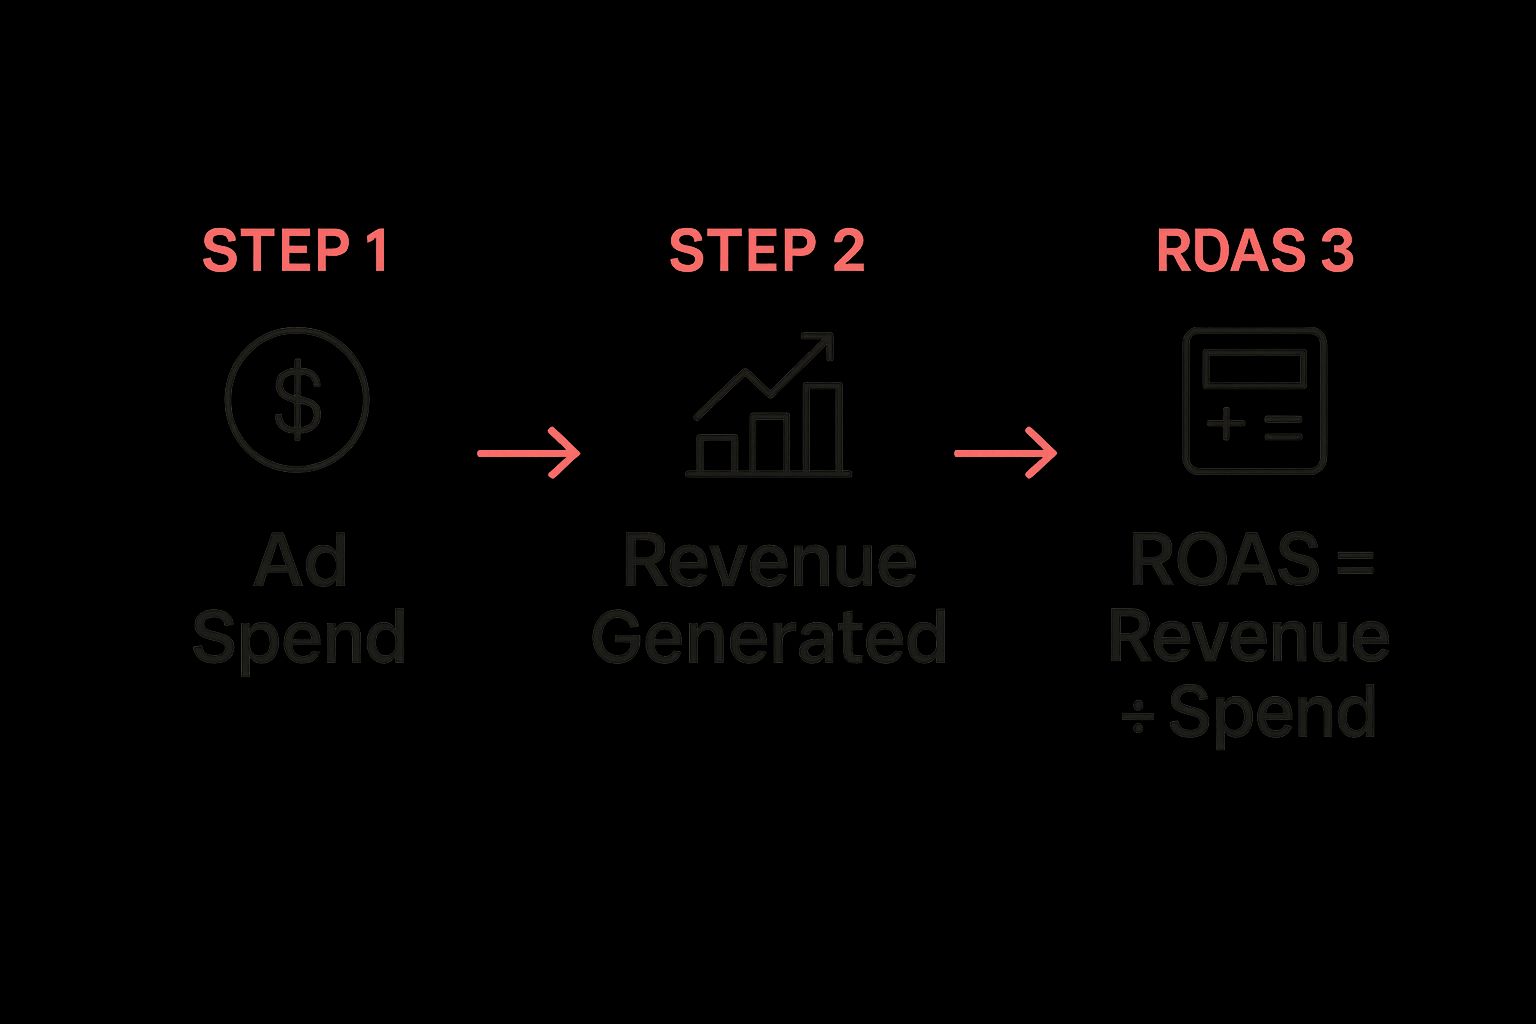
As you can see, it’s a direct line from your inputs—what you spent and what you earned—to that final, all-important ROAS figure.
Key Inputs For Your ROAS Calculation
To get a ROAS number that you can actually trust, you need to be honest about your inputs. “Ad spend” isn’t just what you pay Google, and “revenue” needs to be tracked properly. This table breaks down what should go into each side of the equation.
| Metric Input | What to Include | Example |
|---|---|---|
| Total Ad Spend | The money paid directly to the ad platform (Google, Meta, etc.), plus any agency fees, creative design costs, and subscriptions for ad-related software. | $1,000 platform cost + $200 agency fee + $50 for ad creative = $1,250 Total Ad Spend |
| Attributed Revenue | All sales that can be directly credited to a specific ad campaign, based on your platform’s conversion tracking and attribution model. | A customer clicks your ad, browses, and then buys two days later. That revenue still counts. |
Getting these two numbers right is the foundation of a meaningful ROAS calculation. One without the other just gives you half the story.
Identifying Your Total Ad Spend
If you want a true picture of performance, you have to count every single cost that goes into running your campaign. It’s easy to just look at what you paid the ad platform, but that’s only part of the story.
Your Total Ad Spend needs to include things like:
- Platform Costs: This is the obvious one—the actual bill from Google, Meta, TikTok, or whoever you’re advertising with.
- Creative Costs: Did you pay someone to design ad graphics, write your copy, or shoot a video? That’s an ad cost.
- Agency or Freelancer Fees: If you’ve hired help to manage your campaigns, their fees are absolutely part of the ad spend.
- Tool and Software Subscriptions: The monthly cost for any software you use to create, manage, or analyze your ads counts, too.
Forgetting these “hidden” costs will make your ROAS look way better than it actually is, giving you a false sense of success. A truly accurate calculation requires you to be brutally honest about every dollar you spent.
Attributing Revenue Correctly
Getting your revenue attribution right is just as critical. You have to be sure the sales you’re counting were actually driven by your ads. Most ad platforms offer conversion tracking to handle this, but it’s on you to make sure it’s set up correctly.
For instance, what if a customer clicks your ad today but doesn’t actually buy for another week? A properly configured attribution window will still give that sale credit to your campaign. This is huge, as it stops you from undervaluing ads that influence purchases over a longer period. You can take a deeper dive into this by checking out our guide on how to calculate ROAS, which gets into the weeds on attribution models.
When you diligently track both your total costs and your attributed revenue, this simple formula becomes an incredibly powerful diagnostic tool. It gives you the clarity you need to make smart, data-backed decisions with your marketing budget.
What a Good ROAS Looks Like in the Real World
So, your return on ad spend calculator just spit out a number. Now what? The big question on every marketer’s mind is, “Is this actually any good?” It’s easy to go looking for a magic number, a single ROAS benchmark that screams “success,” but the truth is, it just doesn’t exist.
A killer ROAS for one brand could spell disaster for another.
Think about it this way: what’s a “good speed” for a vehicle? The answer is totally different if you’re behind the wheel of a Formula 1 car versus captaining a massive cargo ship. Context is everything. The same goes for ROAS, where your profit margins, industry, and business goals all shape what “good” really means for you.
The Profit Margin Connection
Your profit margin is the single most important piece of the puzzle. It determines your break-even point. Before you even sniff a profit, your ROAS needs to cover not just the ad spend, but also the cost of the products you sold.
For a business with juicy margins, like a company selling digital courses, a 2:1 ROAS might be fantastic. They get $2 back for every $1 spent, and with low product costs, most of that second dollar is pure profit.
But for a retailer with razor-thin margins, a 5:1 ROAS might be the bare minimum just to keep the lights on.
Knowing your break-even ROAS is non-negotiable. It’s the floor. It’s the number that tells you if a campaign is actively losing you money or has a fighting chance. Anything below this number is a leak in your budget that you need to plug, fast.
Setting Realistic ROAS Targets
Once you know your break-even number, you can start setting some real goals. While every industry is different, we can look at a few general benchmarks to get our bearings.
- 2:1 ROAS: For many businesses with decent margins, this is the break-even zone. You’re not exactly popping champagne, but you’re not losing money on ads, either.
- 4:1 ROAS: This is a super common target for e-commerce brands. A 400% return usually leaves enough room to cover all your costs and pocket a healthy profit. It’s a solid goal to aim for.
- 10:1+ ROAS: Hitting a 10x return or higher? That’s exceptional. This is the stuff of legends, pointing to a perfectly dialed-in campaign with spot-on targeting and creative that just clicks.
Recent marketing data often points to that 4:1 ROAS as a healthy, widely-accepted benchmark. Of course, this varies. Retail brands might shoot for 5x to 10x, while some service industries might see lower returns because of longer, more complex sales cycles.
Ultimately, ROAS is a powerful health check for your marketing. A low number doesn’t always mean your ads are bad. It could be a signal that something else is broken, like a clunky checkout process that’s causing people to ditch their carts. Fixing that part of the customer journey is critical, and you can learn exactly how to reduce your cart abandonment rate in our full guide.
Avoiding Common ROAS Calculation Mistakes
An inaccurate ROAS is far more dangerous than having no ROAS at all. A flawed number can send you down the wrong path, causing you to pump money into failing campaigns or, even worse, cut the winners short. Using a return on ad spend calculator is simple, but its output is only as good as the data you feed it.
Plenty of businesses make simple errors that completely distort this vital metric, leading to bad decisions and wasted ad spend. Getting your calculations right means being brutally honest about every single cost and crediting every sale correctly. The good news? These common pitfalls are easy to sidestep once you know what to look for.
Forgetting Hidden Costs
One of the most frequent mistakes is only counting the direct platform spend—what you pay Google or Meta—as your total cost. This gives you a falsely inflated ROAS because it ignores the full investment it took to actually run your campaigns. A true calculation has to be comprehensive.
To get an accurate picture, your “Total Ad Spend” input must include:
- Agency or Freelancer Fees: The cost of hiring experts to manage your campaigns is a direct advertising expense.
- Creative Production: Did you pay for graphic design, video editing, or copywriting? That’s part of the cost.
- Software and Tools: Any subscription fees for ad management, analytics, or creative tools should be factored in.
Overlooking these “hidden” expenses is like calculating the cost of a road trip but only counting the fuel. To understand the real cost, you have to include the tolls, snacks, and maintenance—every dollar spent contributes to the journey.
Using Flawed Revenue Attribution
Equally problematic is failing to attribute revenue correctly. If your tracking is off, you might not give a campaign credit for a sale it genuinely generated. This happens all the time with products that have a longer consideration phase, where a customer might click an ad but not purchase for several days.
Make sure your attribution window is set up to reflect your typical customer’s buying cycle. A 7-day or 28-day window can capture sales that a last-click model would miss, giving you a much truer sense of a campaign’s impact.
Another critical attribution failure is overlooking the impact of a poor user experience. Your ads might be driving tons of high-quality traffic, but if your checkout process is clunky, customers will leave. This isn’t an ad problem; it’s a conversion problem. You can learn more about how to reduce cart abandonment in our dedicated guide, ensuring your ad-driven traffic actually converts.
Actionable Strategies to Improve Your ROAS
Knowing your numbers is the starting point. Improving them is how you actually scale your business. Once your return on ad spend calculator gives you a clear baseline, the real work begins: making every single ad dollar work harder for you. The good news is that boosting ROAS isn’t about some secret formula; it’s about systematically tweaking your campaigns to cut the fat and maximize your impact.
This whole process kicks off with a laser focus on who you’re talking to. A lot of the time, wasted ad spend is just a symptom of sloppy audience targeting. If your ads are reaching people who will never, ever buy your product, your ROAS is going to suffer no matter how brilliant your creative is.
Refine Your Audience Targeting
The fastest way to get a better ROAS is brutally simple: stop showing ads to the wrong people. Dive into your analytics and get a crystal-clear picture of the demographics, interests, and behaviors of your most profitable customers. Then, use that data to build hyper-specific audiences.
Think about trying these targeting strategies:
- Lookalike Audiences: Build audiences based on your best existing customers. This lets platforms like Meta go out and find new people who share similar traits. It’s like cloning your ideal buyer.
- Retargeting Campaigns: Don’t let warm leads go cold. Retarget people who have visited your site, added products to their cart, or watched your videos. They’ve already raised their hand.
- Exclusion Lists: Be just as strategic about who not to target. For example, you should actively exclude past purchasers from a new customer acquisition campaign. Why pay to acquire someone who’s already a customer?
By tightening up your targeting, you make sure your budget is spent only on the users most likely to pull out their wallets. This alone can give you an immediate and significant lift in ROAS.
Every dollar spent on an irrelevant audience is a dollar that could have been invested in a potential customer. Precision targeting isn’t just a strategy—it’s the foundation of a profitable ad account.
Enhance Ad Creative and Landing Pages
Your ad creative is what stops the scroll. Your landing page is what closes the deal. Both have to be perfectly aligned to create a smooth, seamless journey for the user. A major reason for low conversion rates is a disconnect between the ad’s promise and what the landing page actually delivers.
To fix this, you need to get serious about A/B testing. Systematically test different headlines, images, calls-to-action, and offers to see what truly resonates with your audience. The data you get from A/B tests removes all the guesswork and lets you make decisions based on real user behavior, not just hunches.
Your landing pages need just as much attention. Make sure they load lightning-fast, look great on mobile, and feature a clear, compelling call-to-action that directly mirrors the message in the ad. For a deeper dive into optimizing your campaigns, check out our detailed guide on how to calculate and improve your return on ad spend. Every small improvement you make in this funnel can add up to a huge boost in your overall ROAS.
How CartBoss Drives a Higher Campaign ROAS

Getting a great Return on Ad Spend isn’t just about tweaking your ads. It’s about squeezing every last drop of value from the traffic those ads bring to your store. This is where CartBoss becomes a secret weapon for your marketing, pumping up the revenue side of your ROAS equation without you spending another dime on ads.
Think about it. Your ad campaigns are out there working hard, bringing shoppers to your digital doorstep. But what happens when they load up a cart and then just… leave? Poof. The money you spent to get that visitor is gone. CartBoss is designed to plug this exact leak in your sales funnel.
By automatically sending perfectly timed SMS reminders to shoppers who bail on their carts, CartBoss re-engages buyers who were this close to purchasing. It brings them right back to complete their order, recovering sales that would have otherwise vanished into thin air. That recovered money goes straight back into the revenue column for your original ad campaign.
Turning Abandoned Carts Into ROAS Fuel
Let’s say your latest ad campaign results in 100 people abandoning their carts. Without a recovery plan, that’s a huge chunk of potential income just sitting there. But by recovering even a small fraction of those carts, CartBoss directly increases the total revenue generated by your initial ad spend.
This has a massive impact on your ROAS calculation:
- Ad Spend: Stays exactly the same. You don’t spend a single extra cent on ads.
- Revenue: Goes up with every single cart you recover.
It’s a simple dynamic that completely changes the game. For example, if you spend $1,000 on ads and make $4,000, your ROAS is 4x. Nice. But if CartBoss recovers another $1,000 in lost sales from that same traffic, your revenue jumps to $5,000. Suddenly, your ROAS is 5x—all without touching your ad budget.
Adding a tool like CartBoss is one of the smartest moves you can make to get more from your advertising. It ensures your budget has the maximum possible impact by converting the visitors you’ve already paid to attract.
To dive deeper into this strategy, check out our complete guide on abandoned cart recovery, which breaks down exactly how to win back these valuable customers.
Common Questions About ROAS
Even when you’ve got a handle on the basics, a few common questions always pop up once you start putting ROAS into practice. Getting clear answers is the key to moving from just plugging numbers into a return on ad spend calculator to actually making smart, strategic decisions with that data.
Let’s dive into some of the questions we hear most often.
What Is the Difference Between ROAS and ROI?
Think of it like this: ROAS and ROI are two different camera lenses for looking at your business.
ROAS is the zoom lens. It’s focused super tightly on one thing: the effectiveness of a specific ad campaign. It tells you the gross revenue you’re generating for every single dollar you spend on ads. It’s a pure marketer’s metric for checking the pulse of a campaign.
ROI, on the other hand, is the wide-angle lens. It pulls back to show you the bigger picture—the overall profitability of your investment. It takes all costs into account, like the cost of your products, shipping fees, and any other operational expenses. A killer ROAS is great, but a positive ROI is what actually keeps the lights on.
ROAS tells you if your ads are bringing in revenue. ROI tells you if that revenue is actually turning into profit. You absolutely need both, but they answer very different questions.
Can You Have a Good ROAS but Still Lose Money?
Absolutely. And this is a critical trap you have to avoid. This happens all the time when your profit margins are too thin to cover your ad spend. A campaign can look like a massive success on the surface while it’s quietly bleeding your bank account dry.
For example, say you’re hitting a 2:1 ROAS. You’re making $2 for every $1 you spend on ads—sounds good, right?
But what if your profit margin is only 40%? That means for that $2 sale, your cost for the product itself was $1.20. Now, add the $1.00 you spent on the ad. Your total cost is $2.20. You just lost $0.20 on that “successful” sale. This is exactly why figuring out your break-even ROAS isn’t just a good idea; it’s non-negotiable.
Ready to stop guessing and start knowing your real numbers? CartBoss helps you maximize the revenue from every ad click by recovering abandoned carts with automated SMS. Turn lost sales into a higher ROAS, effortlessly. Learn more at https://www.cartboss.io.