
Figuring out your return on ad spend is actually pretty simple. You just take the revenue you brought in from an ad campaign and divide it by what you spent on that campaign. That’s it. This quick calculation gives you a clear ratio, showing exactly how much you’re earning for every dollar you put into advertising.
It’s the ultimate reality check for your campaign’s profitability.
Why Return on Ad Spend Is Your Most Important Metric
In a world full of vanity metrics like clicks, impressions, and likes, Return on Ad Spend (ROAS) cuts straight to the point. It gives you a direct answer to the one question every marketer needs to know: “Are my ads actually making money?”
While other metrics have their place, ROAS is your bottom line. It’s the number that tells you if your advertising efforts are a smart investment or just a money pit.
Frankly, understanding ROAS is non-negotiable if you want a profitable ad strategy. It helps you shift from just throwing money at ads to strategically putting your budget where it will generate the biggest returns. If you want to go even deeper, our complete guide on how to calculate ROAS is a great next step.
The Core Formula Explained
At its heart, the ROAS formula is straightforward. But getting it right depends on knowing exactly what numbers to plug in. Let’s break down the two main components you’ll need to nail down for an accurate calculation.
To make it crystal clear, here’s a simple table breaking down what goes into the formula:
ROAS Formula Components Explained
| Component | Description | Example |
|---|---|---|
| Revenue from Ads | This is the total sales value generated directly from your ad campaign. You absolutely need accurate conversion tracking for this. | A Facebook ad campaign generated $5,000 in direct sales. |
| Cost of Ads | The total amount you spent to run the campaign. This includes platform fees, agency costs, creative production—everything. | The total cost to run that Facebook campaign was $1,000. |
Remember, your ROAS calculation is only as good as the data you use.
Key Takeaway: An accurate ROAS calculation depends entirely on clean data. If your revenue attribution is off or you forget to include hidden costs, your final number will be misleading.
To put it all together, let’s use the example from the table. If a campaign costs $1,000 and brings in $5,000 in revenue, the ROAS is 500% (or a 5:1 ratio). This means for every $1 spent, you made $5 back.
Of course, what’s considered a “good” ROAS can vary a lot by industry. For instance, the automotive sector often sees a ratio around 1.93. It’s always a good idea to see how you stack up against others in your space.
Tracking the Right Numbers for an Accurate ROAS
To get a real, honest ROAS, you absolutely have to start with clean data. Your final ROAS figure is only as good as the numbers you plug into it, so getting this part right is crucial. It all begins with tracking down every single dollar you’ve actually spent on your campaigns.
It’s easy enough to grab the main ad spend from your Google Ads or Meta dashboards. But that number? It’s often just the tip of the iceberg. The true cost of your ads includes a lot more than just what you paid for the clicks.
Pinpointing Your Total Ad Costs
I’ve seen it happen countless times: a store owner thinks their ROAS is incredible, only to realize they’ve forgotten all the “hidden” costs. To get a complete picture of your investment, you need to account for everything.
- Agency or Freelancer Fees: Don’t forget the management fees you pay the pros running your campaigns.
- Creative Production: That money you spent on ad visuals, copywriting, or video production? It counts.
- Software and Tool Subscriptions: Any specialized software you use for ad management or analytics has to be factored in.
If you skip these expenses, you’ll end up with an inflated ROAS that gives you a false sense of security. Add all these up, and you’ll have your true “Ad Cost” for the formula.
Attributing Revenue Correctly
Now for the other side of the coin: revenue. Reliable conversion tracking isn’t optional here. You have to know with certainty which sales came directly from your ads. This is where tools like tracking pixels and UTM parameters become your best friends.
An e-commerce platform like Shopify gives you great sales analytics, but you still have to make sure it’s attributing those sales to the right channels. For truly accurate ROAS measurement, using integrated marketing platforms can be a huge help, pulling all your data together from multiple touchpoints.
Pro Tip: Watch out for last-click attribution bias. A customer might see a Facebook ad, get an email, and then click a Google ad before buying. A multi-touch attribution model will give you a much clearer picture of how all your channels are working together.
This level of detail is especially important for high-engagement channels. You can learn more about how this works for direct-to-consumer channels in our guide on SMS marketing for ecommerce, where getting attribution right is absolutely key to proving its value.
A Real-World ROAS Calculation in Action
Theory is one thing, but let’s get our hands dirty with some real numbers. Seeing how to calculate return on ad spend in a practical scenario makes the whole concept click. It gives you a clear blueprint you can swipe and use for your own campaigns right away.
Let’s imagine your e-commerce store is running a coordinated marketing push across two key platforms. You’ve set your budget like this:
- Google Ads Spend: $700
- Facebook Ads Spend: $300
That brings your Total Ad Cost to a nice, round $1,000. Once the campaign wraps up, you dive into your analytics and discover those ads brought in $4,000 in revenue.
Now, let’s plug those numbers into the ROAS formula:
ROAS = Total Revenue / Total Ad Cost
ROAS = $4,000 / $1,000
ROAS = 4
What you’re looking at is a 4:1 ROAS. In plain English, for every $1 you put into ads, you got $4 back in sales.
What This Number Actually Tells You
A 4:1 ROAS is a solid start and definitely a reason to feel good about your campaigns. But hold on—it’s not the whole story. While it confirms your ads are driving sales effectively, it doesn’t automatically mean you’re profitable. To get the full picture, you still need to account for the cost of your products and all the other expenses of running your business.
This visual breaks down how the data flows from your initial investment to the final calculation.
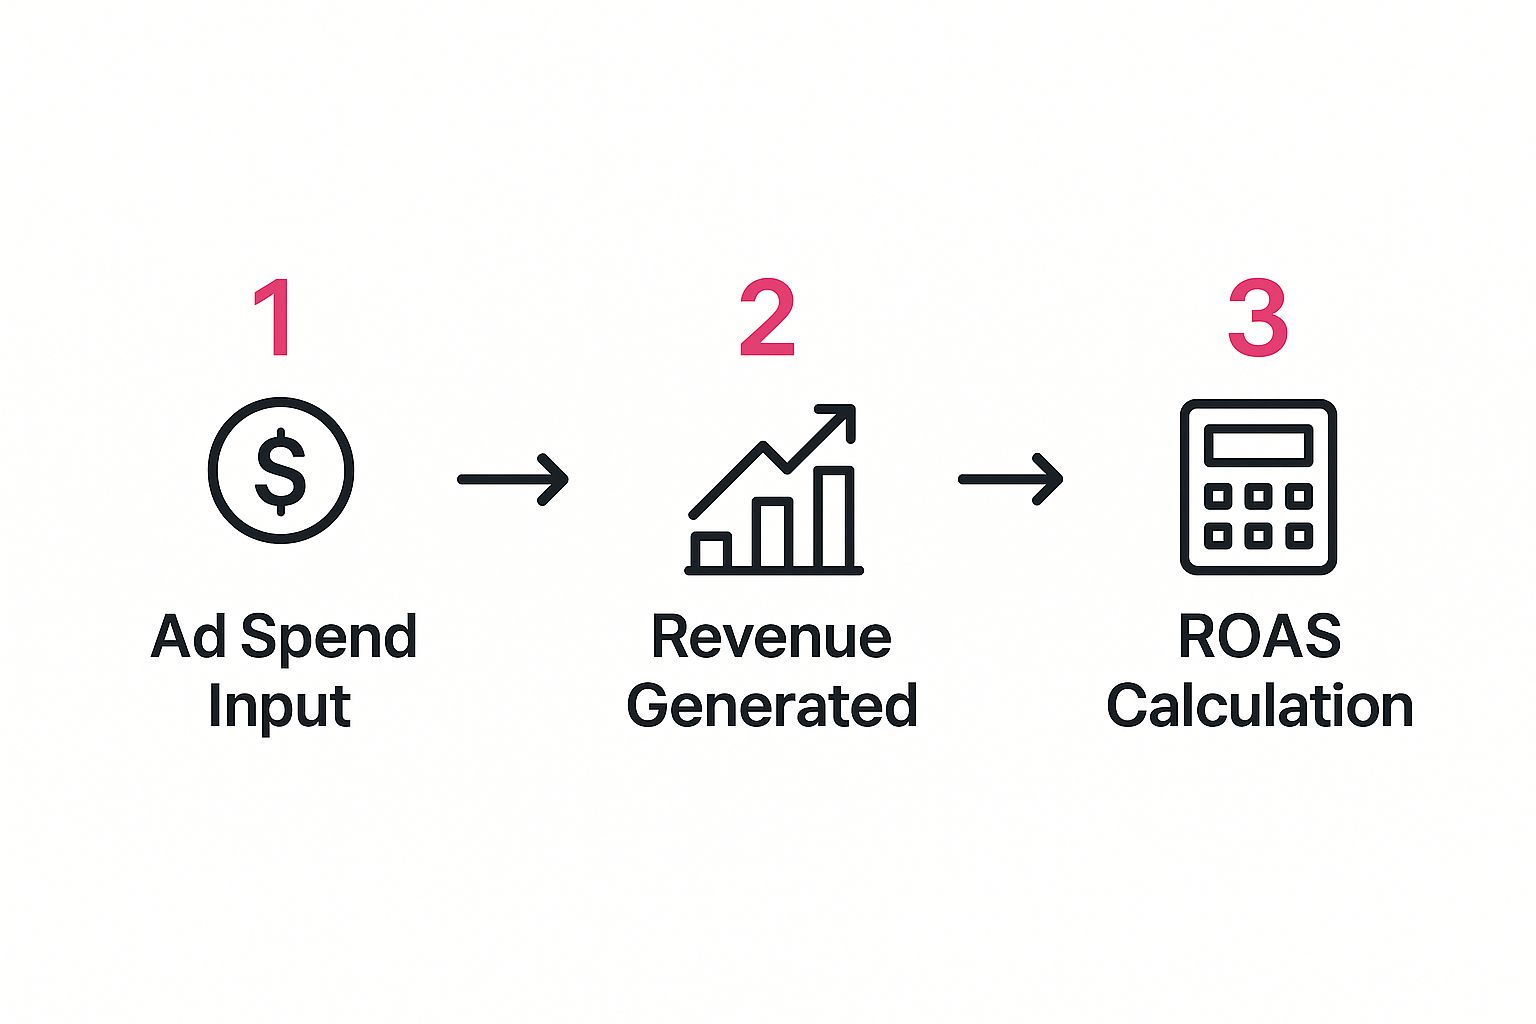
As you can see, calculating ROAS is a straightforward result of tracking what you spend and what you earn. Tweak either of those, and your final number will change.
While a high ROAS is the goal, remember that even the most brilliant ad campaigns can leak money if the customer experience hits a snag. A critical, and often overlooked, step is to recover abandoned carts. By doing so, you ensure you’re capturing every possible dollar from the traffic you’ve already paid to attract.
What a Good ROAS Actually Looks Like
So you hit that 4:1 ROAS you calculated earlier. That feels pretty great, right? But here’s the million-dollar question: is your business actually more profitable because of it? The ROAS number itself is just revenue, not profit. A “good” ROAS isn’t some universal benchmark you can pull off a chart; it’s a number that’s entirely unique to your business.
The hard truth is that your ideal ROAS depends almost entirely on your profit margins. A business selling high-margin luxury goods can absolutely thrive on a 3:1 ROAS. On the flip side, a store selling low-margin commodity items might need to crush an 8:1 ROAS just to stay afloat. And that’s before you even factor in things like operating costs, team salaries, and your overall business goals.
Finding Your Break-Even Point
To figure out what a successful ROAS looks like for you, the first thing you need to do is calculate your break-even point. This isn’t just about covering your ad spend. This is the minimum ROAS you need to cover your ads and the cost of the goods you sold (COGS).
The formula is refreshingly simple: Break-Even ROAS = 1 / Profit Margin.
Let’s say your profit margin is 25% (or 0.25). Your break-even ROAS would be 1 / 0.25, which comes out to 4. This means you need to achieve a 4:1 ROAS just to cover your costs. Anything below that, and you’re actively losing money on every single sale, no matter how impressive the revenue numbers might seem.
Key Insight: Knowing your break-even ROAS transforms the metric from a vanity number into an actionable health indicator for your campaigns.
This calculation becomes absolutely critical in hyper-competitive markets. For instance, the United States is projected to be the largest advertising market on the planet, with ad spend expected to rocket past 300 billion USD in 2024 alone. In an environment like that, just tracking top-line revenue won’t cut it. You can discover more about these advertising trends on cropink.com.
The Next-Level Metric: POAS
If you want an even clearer, more honest view of your profitability, many savvy marketers are now shifting their focus to Profit on Ad Spend (POAS). It’s a simple but powerful switch. Instead of using revenue in your calculation, you use your gross profit.
This metric cuts straight to the chase and answers the most important question: how much actual profit are your ads generating? It’s the ultimate stress test for any campaign’s success.
Actionable Strategies to Improve Your ROAS
Knowing how to calculate your ROAS is just the first step. The real goal is to actively improve it, and that doesn’t mean you just need to throw more money at your ads. It’s all about spending smarter and zeroing in on high-impact areas that squeeze better results from the budget you already have.
A great place to start is by refining your audience targeting. Platforms like Facebook and Google let you get incredibly specific. Instead of casting a wide net with broad interests, drill down to users who’ve shown real purchase intent—think people who’ve visited specific product pages or, even better, already added items to their cart. This laser focus ensures your ad dollars are spent on people who are genuinely close to converting.
Enhance Your Creatives and Landing Pages
Think of your ad creative as your digital handshake. It’s the first impression you make. I always recommend that my clients continuously A/B test different ad copy, images, and calls-to-action. You’d be amazed at how a small tweak in a headline or a different visual can completely change your campaign’s performance.
Once someone clicks, the journey is far from over. Your landing page has to seal the deal. Make sure it’s fast, looks great on mobile, and directly continues the conversation started by the ad they just clicked. Nothing kills ROAS faster than a slow, clunky landing page that feels disconnected from the ad.
Pro Tip: Your efforts to improve ROAS can’t stop at the ad click. A huge number of interested visitors will leave without buying anything. This is where implementing proven shopping cart abandonment solutions becomes critical. It helps you capture revenue from traffic you’ve already paid for.
Build a Multi-Touch Retargeting Funnel
Don’t let interested leads just walk away. A smart move is to build a multi-touch retargeting funnel to re-engage users who showed interest but didn’t pull the trigger. You can serve them a sequence of ads that builds on their initial visit, maybe by offering a small discount or highlighting a key product benefit they might have missed.
Spreading your ad spend effectively across different platforms can also give your ROAS a serious boost. For instance, getting expert help with TikTok Ads Management can unlock a whole new audience.
The competition is only getting fiercer. Global advertising spending is projected to hit nearly 1.1 trillion US dollars in 2024, with online channels making up over 72% of that massive figure. In a market this crowded, every single optimization you make really counts.
Frequently Asked Questions About ROAS
Even after you get the hang of calculating your return on ad spend, a few questions always seem to pop up. It’s a metric that feels simple at first glance, but it has layers of nuance that can trip you up. Let’s tackle some of the most common questions marketers have so you can get some quick clarity.
Answering these is what takes you from just calculating a number to actually using it as a strategic tool for growth.
How Often Should I Check My ROAS?
Honestly, there’s no single magic number here. The right rhythm for checking your ROAS really depends on your campaign’s scale and intensity.
For high-spend, fast-moving campaigns—think a flash sale or a big product launch—checking in weekly is a smart move. This gives you enough time to make meaningful optimizations and shift your budget before you burn too much cash on ads that just aren’t performing.
On the other hand, for smaller, evergreen campaigns, a bi-weekly or even monthly check-in is usually more than enough. The real goal is to find a consistent rhythm. You want to spot genuine trends, not get spooked by the normal day-to-day ups and downs of sales.
What Is the Difference Between ROAS and ROI?
This is a critical distinction, and it’s one that trips people up all the time. While they sound similar, ROAS and ROI are measuring two completely different things.
- ROAS (Return on Ad Spend) looks specifically at the gross revenue you generate for every single dollar spent on advertising. It’s a direct measure of your ad campaign’s efficiency.
- ROI (Return on Investment) is a much bigger-picture metric. It measures the net profit from an investment after you’ve accounted for all costs, not just ad spend. This includes the cost of your products, salaries, software, and any other overhead.
Think of it like this: ROAS tells you how healthy your ad campaigns are, while ROI tells you how healthy your entire business is.
A campaign can have a fantastic ROAS but a negative ROI if your overall business costs and product margins aren’t in a healthy place. Understanding both gives you a complete picture of your profitability.
Can a High ROAS Still Mean Losing Money?
Yes, absolutely. This is one of the most painful but important lessons in advertising. A high ROAS feels great because it proves your ads are bringing in revenue. The problem is, it completely ignores your profit margins.
Let’s say you hit a 3:1 ROAS. Awesome, right? That’s $3 in revenue for every $1 you spent on ads. But what if the product you sold costs you $2.50 to produce, package, and ship? You’ve actually lost $0.50 on that sale. The high ROAS masked a fundamental profitability problem. This is exactly why knowing your break-even point isn’t just a suggestion—it’s non-negotiable.
Should I Track ROAS for Each Marketing Channel?
Yes, one hundred percent. While having a blended, overall ROAS is a useful top-level number, the real, actionable insights come from digging into each channel individually. Your ROAS for Google Ads will almost certainly be different from your ROAS on Facebook Ads or TikTok Ads.
Tracking channel-specific ROAS is how you identify which platforms are your true workhorses. It gives you the confidence to pull budget from underperforming channels and double down on the ones that are actually driving profitable growth. A huge part of this is making sure every click you pay for has the best chance to convert, which is why it’s also smart to find ways to reduce cart abandonment and squeeze every bit of value out of your ad traffic.
Ready to turn those ad clicks into real profit? CartBoss uses powerful automated SMS messages to recover abandoned carts and boost your sales by up to 50%. Maximize your ROAS and win back lost customers effortlessly, all on autopilot. Get started at https://www.cartboss.io.