

81% of surveyed US consumers said poor product or service quality would make them leave a brand, and 69% named fair, competitive pricing as their top reason for repeat purchases, according to Adobe’s customer loyalty research. Neither answer mentions a reminder text, a loyalty point or a discount code.
That gap explains why so many retention programmes disappoint. A store owner buys a messaging tool, switches on an abandoned cart flow, watches the click rate climb, and finishes the quarter with the same repeat purchase rate. The software was never the whole problem. A shopper who left because shipping cost more than the product, because the returns policy felt risky, or because the last order arrived damaged won’t be won back by a better subject line.
Customer retention software earns its budget when it is judged on three things: the profit an intervention adds, the operational faults it exposes, and whether a customer behaves differently six months later. Everything below is written to help you test those three things before you sign a contract.
Table of Contents
- What Customer Retention Software Does and Why It Matters
- Core Capabilities to Evaluate at a Glance
- How Predictive Churn Scoring Prioritizes Shoppers
- Diagnose Why Shoppers Leave Before You Send a Message
- Confirm Compliance and Costs Before You Launch
- How to Set Up an Automated SMS Recovery Flow
- Measure Incremental Profit and SMS Click Benchmarks
What Customer Retention Software Does and Why It Matters
Picture a shop assistant who remembers every customer. She knows who bought the winter coat in October, who asked about a size that was out of stock, and who hasn’t been back since a return went wrong. Customer retention software turns that memory into a system. It keeps a record of each shopper, watches what happens after the first order, and triggers a message, an offer or a service step at the moment it can still change the outcome.
Three Jobs a Retention Platform Performs
- Identify shoppers after the first order. The tool ties an email address, phone number or account to past purchases, so future messages can reference what someone bought rather than what a segment guessed.
- Spot declining engagement early. A customer who used to order every six weeks and has gone four months without one is a different case from a first-time buyer who never came back.
- Deliver the nudge or the fix. That could be a reminder, a back-in-stock alert, a support follow-up on a damaged delivery, or a clearer returns promise on the product page.
The category didn’t appear from nowhere. Stellaxius’s history of the CRM market notes that Salesforce introduced CRM as a software-as-a-service product delivered over the internet in 1999, and reports the global CRM market at roughly $52.4 billion in 2021 with a 13.3% compound annual growth rate projected from 2022 through 2030. Retention tools inherited that architecture: one continuously updated customer record that several systems can read.
The economics explain the investment. Bain & Company’s retention research reported that a 5% increase in customer retention can raise profits by 25% to 95%, depending on the industry and business economics, and that an analysis of more than 156,000 direct-to-consumer customers found only 18.8% placed a second order within one year, leaving roughly 81% who did not return in that period. Bain also cited MBNA, where a 5% retention increase produced a 60% profit increase by the fifth year, and a benchmark showing the average retailer retained 27.4% of its previous year’s buyers in 2024.
Treat none of those as targets. Retention varies by category, purchase frequency, geography and the measurement window you pick. The question worth carrying into a vendor call is simpler: which of your customers would come back without help?
Core Capabilities to Evaluate at a Glance
Every demo shows the same three screens: a dashboard, a flow builder and a chart that goes up. None of them tells you whether the tool will make money. Score each vendor against the six capabilities below before anyone mentions price, because a cheap tool without consent records or holdout testing costs more after launch than it saves at signature.
| Capability | What it does | What to verify before buying |
|---|---|---|
| Customer segmentation | Groups shoppers by purchase completion, cart abandonment and newsletter sign-up | Confirm events trigger in near real time |
| Abandoned cart and win-back flows | Sends timed SMS or email to recover or reactivate shoppers | Check delay control, product links and discount rules |
| Churn and risk scoring | Ranks customers by likelihood to lapse | Ask whether scores use support, usage and billing data, not only purchase frequency |
| Consent and opt-out management | Records permission and honors STOP replies | Verify consent records and immediate suppression of opted-out numbers |
| Incremental analytics | Measures lift against a control group | Require holdout testing and profit-after-discount reporting |
| Platform integration | Connects the store to the sending tool | Confirm support for your platform, such as Shopify or WooCommerce |
Segmentation decides everything downstream. A list that stores only an email address can’t tell a browser from a buyer, and a flow that fires on the wrong event will annoy your best customers. CartBoss segments end users by three events: purchase completion, cart abandonment and newsletter subscription, which is the minimum useful set for a store with more than one kind of shopper.
Where Vendors Take Shortcuts
- A dashboard that reports clicks but no profit. If the only number on the screen is a click rate, you’ll optimise for clicks, and clicks are free to generate with a large enough discount.
- Scoring that ignores service issues. A model fed only on order dates will happily send a promo to a customer whose last three tickets are still open.
- Flows that default to discounts. Watch what happens in the first reminder. A tool that ships with a 10% code in message one has trained your customers to abandon on purpose.
Integration is the row buyers skip and later regret. Confirm native support for Shopify or WooCommerce before you look at template libraries or language packs, because a daily data sync that breaks without notice does more damage than a plain message.
Write the six answers down and score each vendor out of six. A tool that fails two rows is a tool you’ll replace within a year, whatever the monthly fee says.
How Predictive Churn Scoring Prioritizes Shoppers
An emergency department runs on triage. The nurse does not treat everyone in arrival order: chest pain goes ahead of a sprained ankle. A retention platform needs the same discipline, because sending an identical win-back message to every quiet customer spends margin on shoppers who would have returned anyway and reaches the ones already leaving too late.

Public evidence on how these models behave comes mostly from software businesses, and the inputs map cleanly onto e-commerce. In a software-industry case study that compared six classifiers, XGBoost achieved 0.85 recall and 0.86 ROC AUC, with the strongest explanatory variables being support-ticket resolution time, application type, license age and incident count (NOVA IMS churn study). The store equivalents are browsing activity, time since the last order, delivery problems, service tickets and return history.
Running the Tiers as a Weekly Workflow
- Score every customer daily. A nightly refresh puts yesterday’s damaged delivery into today’s queue while the problem is still fixable.
- Split the list by risk and predicted value. Two customers at identical risk justify different interventions when one spends £40 a year and the other £400.
- Send operational risks to an operational fix. A late parcel or an unresolved ticket calls for a delivery update or a human reply; a promotion leaves the cause untouched.
- Educate the low-engagement shoppers. Sizing guides, restock alerts and care tips cost nothing in margin and rebuild the buying habit.
- Reserve incentives for shoppers with price sensitivity and enough value to protect. A discount should recover profit that would otherwise be lost, rather than subsidise customers who were already on their way back.
Recall deserves more weight than precision in this work. Missing an at-risk customer can cost the profit of every future order, while messaging a shopper who would have stayed anyway costs a send and, at worst, a mild discount.
Accuracy alone will mislead you. A model can look strong on a shuffled test set and still rank customers badly in production, so ask for time-based validation, calibration checks and evidence that treated customers behaved differently from an untreated group. Judge the output on incremental profit, because a score that fills the send queue without changing revenue is a reporting feature, nothing more. The guide to churn prediction models covers those inputs and validation steps in more detail.
Diagnose Why Shoppers Leave Before You Send a Message
Seven carts in ten stall before payment. Baymard’s checkout research, built on 14 years of tracking, puts the global average cart abandonment rate at 70.19% and records what shoppers say when asked why they left. The trap is reading that rate as recoverable revenue. Many shoppers walk away for reasons a text message cannot fix, so the response has to match the cause.
| Reason shoppers give | Reported share | Right response |
|---|---|---|
| Browsing or not ready to buy | 42% | Gentle reminder linking to the saved cart, no discount |
| Extra costs such as shipping and taxes | 40% | Show the full total before checkout |
| Slow delivery | 20% | Show delivery times and options before checkout |
| Lack of trust with card details | 19% | Add trust signals and payment assurance at checkout |
The 42% covers everyone who said they were browsing or not ready; the other three shares are calculated among the remaining reasons, so they don’t add up with it. Read the table as a diagnosis and the tactics stop being interchangeable. A shopper stopped by a £6 shipping charge needs that £6 visible before she invests four minutes in checkout, and a discount code answers the wrong question. A shopper who couldn’t find next-day delivery needs a carrier option more than urgency copy. Three of the four fixes are checkout design, which is why diagnosis belongs before software selection.
Some leakage is operational by design. A 2025 DHL survey of 24,000 online shoppers across 24 global markets found that 81% would abandon a purchase if their preferred delivery option was unavailable, and 79% would abandon if their preferred returns option was not offered (DHL ecommerce insights). A returns policy the customer distrusts will outlast any reminder sequence you build.
A Sequence That Fixes the Cause First
- Disclose shipping, taxes and the full order total before checkout. Cost surprise is the single largest stated reason after browsing, so remove it at the cart page rather than answering it in a text.
- Put delivery timing and trust signals next to the buy button. Named carriers, expected arrival dates, secure-payment badges and a plain returns window do more for conversion than a second discount.
- Send reminders and incentives last, and only to the shoppers who were undecided. Link straight to the saved cart, never the homepage, so the shopper doesn’t have to rebuild the order.
If you want to know which browsing patterns predict a real purchase, the guide to understanding customer behavior shows how session and product-view data separate a browser from a buyer.
Confirm Compliance and Costs Before You Launch
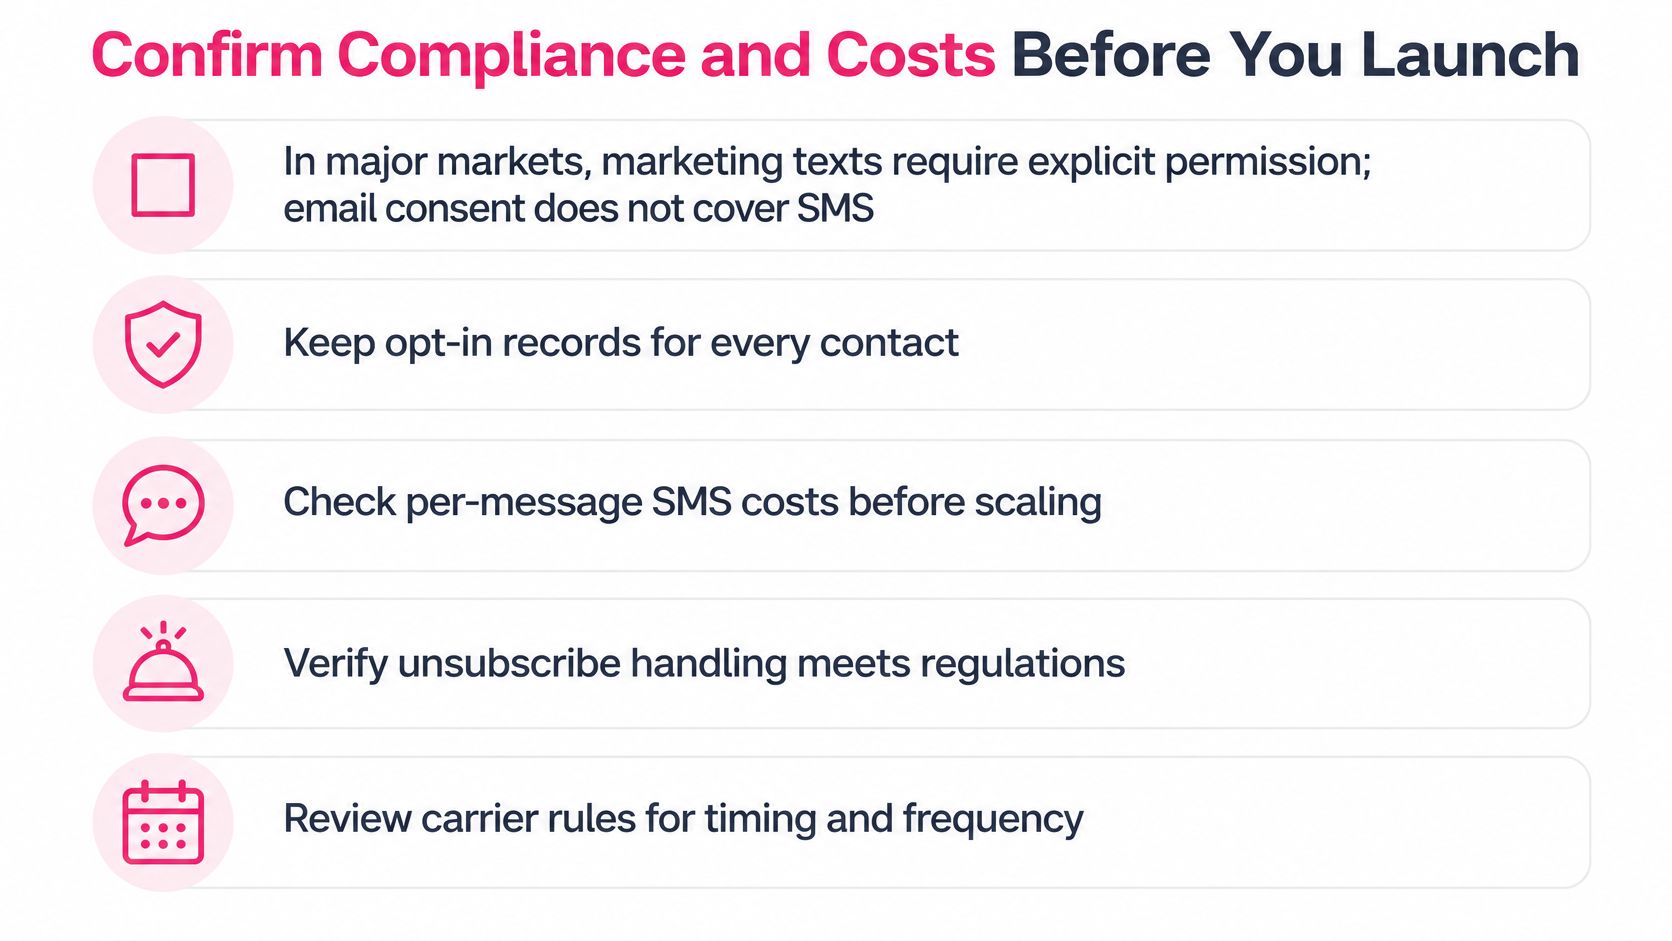
Consent is the rule that trips up most stores, and it trips them up at the exact moment they scale. The UK Information Commissioner’s Office states that unsolicited direct marketing by text is covered by PECR, and that consent should be knowingly and freely given, clear and specific, tied to the organisation and the communication type, and demonstrated through a clear positive action such as ticking a box (ICO guidance on electronic marketing). Two further details matter: consent for email is not automatically consent for text messages, and every message must carry a simple, free way to opt out.
The test that matters: could you show a regulator the exact box this person ticked, the wording beside it, and the date it was recorded?
That means an unticked, SMS-specific checkbox that names your brand, says what the messages are for and roughly how often they arrive. CartBoss records whether each consent checkbox was displayed, what content it related to and whether the shopper ticked it, and keeps those records as evidence that messages were sent lawfully. Suppress opted-out numbers the moment a STOP arrives, and review local rules separately for every country you ship to.
Then price the programme before the first send. Per-message rates differ sharply by destination: on CartBoss pricing, one SMS to the United States costs 0.025 €, one to Germany costs 0.1484 € and one to France costs 0.102 €. Multiply each rate by the volume you expect in that market, add the discount budget, and hold the total against the profit the flow should return.
The Pre-Launch Checklist
- Capability check. Confirm the platform passes each row of the capabilities table, especially consent records and holdout testing.
- Live checkbox. Verify the unticked, SMS-specific box appears at every signup point, including popups, footer forms and checkout.
- Record test. Sign up yourself and confirm the stored record shows the checkbox, its wording and your tick.
- Opt-out test. Reply STOP from a test number and check that suppression is immediate.
- Message footer. Open every live template and confirm the opt-out instruction is present.
- Market review. List every destination country and confirm local rules before the first international send.
- Margin check. Add monthly message costs and expected discount spend, then compare with the profit the flow should produce.
The full set of requirements is broken down in this SMS compliance checklist. Tick all seven boxes before launch, not after.
How to Set Up an Automated SMS Recovery Flow
Automated platforms run cart recovery and win-back without anyone pressing send. CartBoss handles abandoned-cart recovery and runs post-purchase or win-back SMS flows automatically, billed per message, so the setup work is mostly rules, timing and copy rather than daily labour.
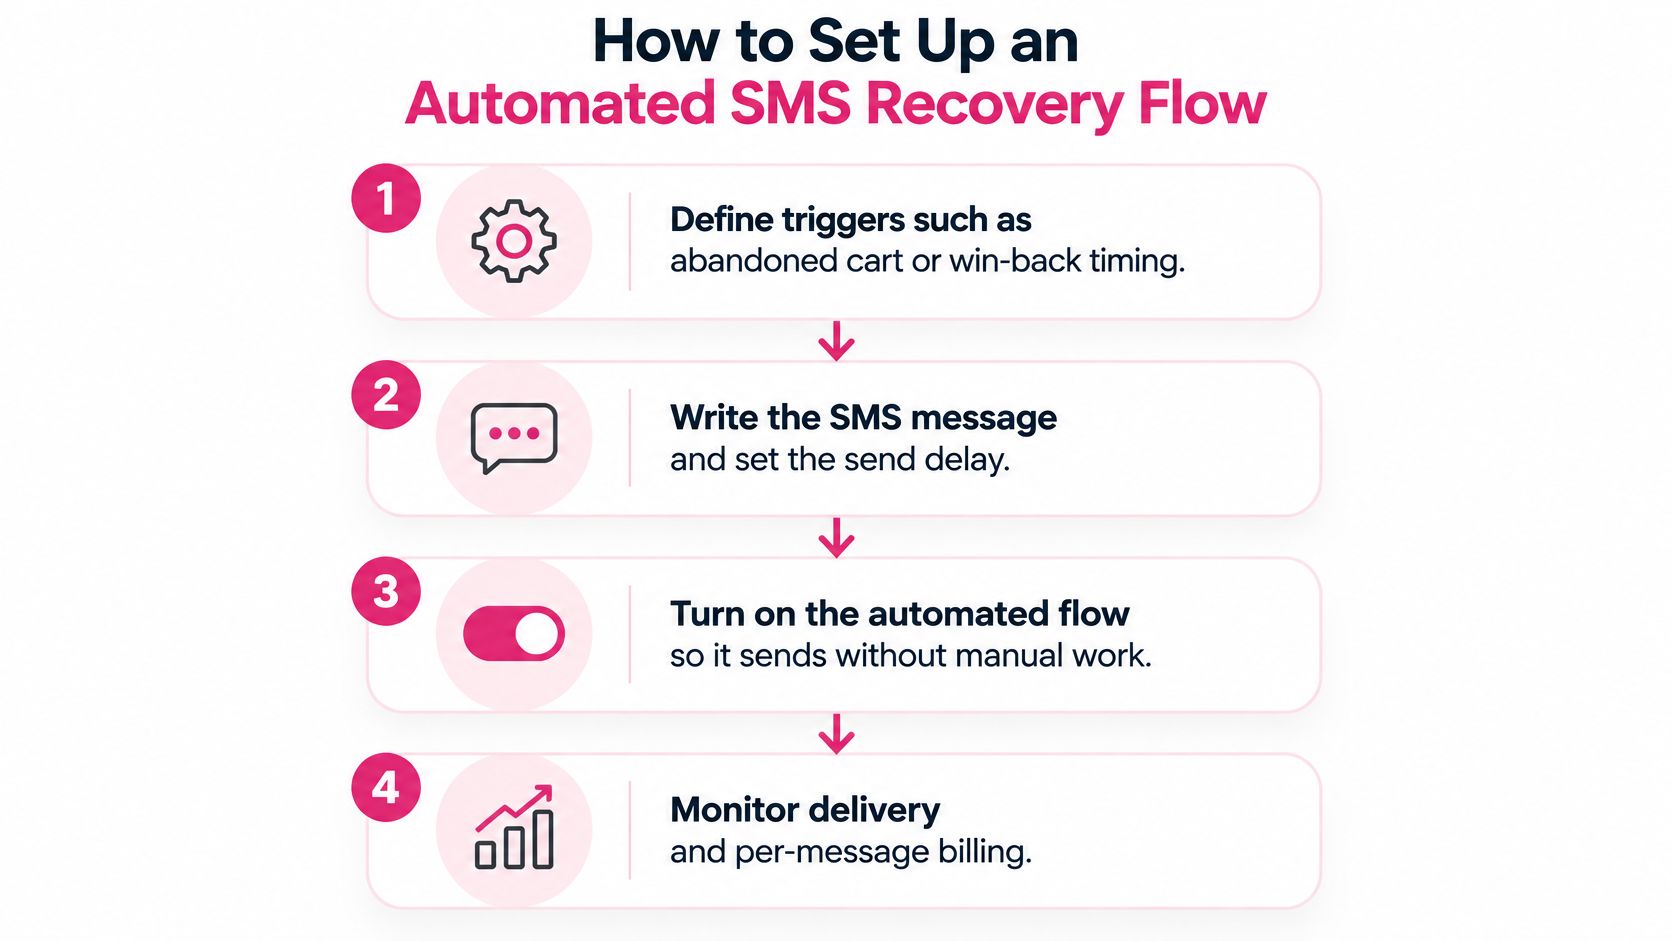
- Connect the store and test the trigger. Confirm the abandonment event fires only when a shopper reaches checkout and leaves, not on wishlist clicks or product views. The common slip is leaving test orders in the live flow, which pollutes your first week of numbers.
- Set the first reminder close to the abandonment. Within the hour the product is still on the shopper’s mind and the reason for leaving is still fresh. Wait a day and you’re competing with a competitor’s delivery promise.
- Write the first message without a discount. Name the product and the store and link to the saved cart. A homepage link loses the cart; a discount in message one teaches shoppers to abandon on purpose.
- Add a second reminder three hours later. CartBoss sends a second reminder 3 hours after a visitor leaves their cart, and if they still haven’t ordered, it includes a discount offer.
- Limit the discount to shoppers who clicked but didn’t buy. Someone who never opened the message hasn’t shown interest in the offer, and margin spent there recovers nothing.
- Turn on do-not-disturb hours and STOP handling before launch. A 2am text costs you an opt-out and possibly a complaint, and a STOP that isn’t honoured immediately costs you the contact entirely.
- Review the first week on four numbers. Click rate, purchases, opt-outs and profit after discounts and message costs. Only the fourth one pays rent.
The format that works is narrow and repeatable. SMS reminders that fill the room shows the structure event organisers rely on: name the thing, give the deadline, one link. Cart recovery messages get better when they copy it.
Template one, sent shortly after abandonment, no discount: Hi [First name], you left [Product] in your cart at [Store]. It is still waiting: [Saved cart link]. Reply STOP to opt out.
Template two, three hours later and only if no order was placed: Your [Product] is still saved. Use code [CODE] for [X]% off today: [Saved cart link]. Reply STOP to opt out.
Adjust both before scaling, and test one variable at a time. A sequence that recovers orders in week one is a starting point, not a finished result. The structural guidance in this abandoned cart sequence helps you decide what to change next.
Measure Incremental Profit and SMS Click Benchmarks
Clicks are the easiest number to report and the least useful on their own. A yardstick helps before you judge your own results: Klaviyo’s SMS benchmark guidance sorts campaign click rates into four bands, and its separate flow guidance places SMS flow click rates at 10.9% to 14.9%, which is the range to aim at for an abandoned-cart sequence.
| Rating | SMS click rate | Action to take |
|---|---|---|
| Great | 14.6% or higher | Keep the flow and test one variable at a time |
| Good | 8.9% to 14.5% | Test send timing and message length |
| Needs improvement | 6.0% to 8.8% | Rework the offer and product imagery |
| Critical | Below 5.9% | Pause and review the message and audience |
Prove the Lift With a Holdout
A click is a reflex. Profit is the point, and the only honest way to attribute it is a randomised holdout: split eligible shoppers, message most of them, and leave a small control group untouched for the same period. Then compare five things.
- Incremental orders. Orders in the treated group minus orders in the control, not total attributed revenue.
- Incremental gross profit after discounts and message costs. This is the number your accountant cares about.
- Opt-out rate. Rising unsubscribes are an early signal that frequency or tone is wrong.
- Repeat purchase rate by acquisition cohort. A recovered order isn’t loyalty until the second or third purchase lands.
- Customer lifetime value over time. Judge it over months, not the week of the campaign.
The distinction between preserved and created revenue runs through every retention metric. A SaaS Capital survey reported by Planhat, covering more than 1,000 private B2B SaaS companies, put median gross revenue retention at 91% and median net revenue retention at 101%, and the ten-point gap comes from expansion revenue masking lost accounts. Your store equivalent is a flow that reports recovered orders without asking whether those orders would have happened anyway.
The go or no-go rule: expand the pilot only if incremental profit after discounts and message costs holds up across the whole pilot period, not just the launch week.
Revenue per delivered message belongs on the same report, because generous discounts hide margin erosion behind a healthy click rate. Change one variable per test, send delay, message length or incentive size, and keep the change only when profit rises. The incrementality testing method walks through how to set up the split and read the result without fooling yourself.
CartBoss sends automated SMS reminders to shoppers who leave a cart, links them straight back to the saved item, and records the consent each contact gave. It connects to Shopify and WooCommerce stores, and the first cart it recovers for a store is free of charge, so you can measure the lift on your own traffic before spending anything. Start at CartBoss and find out what your abandoned checkouts are worth.