
Figuring out your conversion rate is actually pretty simple. All you have to do is divide the number of conversions by the total number of visitors and then multiply that by 100. This one formula is the bedrock for understanding how well your marketing and website are actually performing.
Calculating Your Conversion Rate: The Core Formula

The math behind conversion rates might seem basic, but it unlocks some seriously powerful insights into how people behave on your site. At its core, the formula is just the ratio of completed actions to your total visitors, shown as a percentage.
Let’s say an eCommerce store gets 20,000 visitors in a month and makes 500 sales. That gives them a solid 2.5% conversion rate. Simple, right?
The Basic Equation
Here’s the formula in its purest form:
(Total Number of Conversions / Total Number of Visitors) x 100 = Conversion Rate %
This calculation works for just about any goal. A “conversion” could be a sale, someone signing up for your newsletter, or filling out a contact form. The “visitors” part can mean unique users or total sessions—it really just depends on what you’re trying to measure. Getting this distinction right is crucial for accurate analysis, which is why we’ve put together a full guide on what is conversion rate.
Applying the Formula to Different Goals
How you use this formula will change based on what you want to achieve. A B2B company is probably tracking demo requests, while someone selling on Amazon is laser-focused on product sales. If you’re on a specific platform like that, it helps to check out a complete guide to calculating and improving your Amazon conversion rate to learn about the little details that matter there.
To give you a clearer picture, I’ve put together a table showing how this single formula adapts to different business needs.
Conversion Rate Formula At a Glance
This table breaks down how the basic formula can be applied across different business objectives, from selling products to generating leads.
| Business Goal | Conversion Action | Denominator (Traffic Source) | Example Calculation |
|---|---|---|---|
| E-commerce Sales | A customer completes a purchase. | Total website visitors. | (400 Sales / 20,000 Visitors) x 100 = 2% |
| Lead Generation | A user submits a contact form. | Total landing page sessions. | (50 Form Fills / 1,000 Sessions) x 100 = 5% |
| Content Marketing | A reader downloads an e-book. | Total unique blog post visitors. | (150 Downloads / 5,000 Visitors) x 100 = 3% |
| SaaS Onboarding | A visitor signs up for a free trial. | Total homepage visitors. | (200 Trials / 10,000 Visitors) x 100 = 2% |
As you can see, it’s an incredibly versatile metric that’s essential for tracking success no matter what your business does.
Defining What a Conversion Really Means

Before you can even think about calculating a conversion rate, you have to ask a simple but critical question: what actually is a conversion for your business? For an eCommerce store, the obvious answer is a sale. But if you stop there, you’re only seeing a tiny piece of the puzzle.
A conversion is really just any valuable action someone takes on your site. For a SaaS company, the main goal might be getting a visitor to sign up for a free trial. If you’re a content creator, a newsletter subscription is probably your holy grail.
The trick is to think about conversions on two different levels. This helps you measure what’s working across the entire customer journey, not just at the finish line.
Macro vs Micro Conversions
Macro-conversions are the big ones. These are the primary goals, the main reason your website or landing page even exists. Think of them as the actions that have a direct, immediate impact on your revenue.
- Making a purchase: The classic eCommerce win.
- Requesting a demo: A huge step for any B2B software company.
- Submitting a quote request: Absolutely essential for service-based businesses.
On the other hand, micro-conversions are the smaller, supporting actions. They signal that a user is moving in the right direction and is genuinely interested. They might not put money in your pocket right away, but they are powerful indicators of purchase intent. Getting a handle on these is fundamental to effective conversion tracking, as they show you how people engage before they decide to buy.
A few examples of valuable micro-conversions include:
- Adding a product to the cart
- Watching a product demo video
- Downloading a free guide
- Creating an account on your site
Tracking both macro and micro-conversions gives you an x-ray view of your sales funnel. You can see exactly where things are clicking and where they’re falling apart. For example, a high number of “add to cart” clicks but a low final purchase rate is a massive red flag pointing straight to a problem with your checkout process.
Putting the Formula into Practice with Real Data

Knowing the conversion rate formula is great, but the real magic happens when you plug in your own data. This is where vague feelings about performance turn into cold, hard facts you can actually use.
Let’s walk through a real-world example using a tool that’s probably already open in another tab: Google Analytics. It’s the go-to source for the raw numbers you need to get an accurate calculation.
Finding Your Data Points
Say you want to figure out the conversion rate for one of your top product pages. To do this, you’ll need to hunt down two key metrics inside your analytics platform.
Most tools make this pretty easy. You just need to navigate to your pages or behavior reports, lock in the date range you’re interested in, and find the specific page you want to analyze.
You’re on the lookout for two things:
- Total Sessions (or Users): This is the total number of visits to your page. It’ll be the denominator in our formula.
- Total Conversions: This is your numerator. You’ll need to have your goals set up correctly (like “Transaction” or “Lead Form Submission”) for this number to show up.
Once you have those two numbers, you’re ready to go. Of course, these numbers don’t exist in a vacuum. Understanding the full story behind your traffic—where people are coming from and what they do on your site—is just as important. For a deeper dive, check out our guide on how to analyze website traffic.
A B2B Lead Generation Example
Let’s shift gears and look at a common B2B scenario. A marketing manager just launched a new landing page for an e-book and wants to see how well it’s performing.
Last month, the page pulled in 5,000 unique visitors. Of those visitors, 150 actually filled out the form to download the e-book.
The math here is simple:
(150 Downloads / 5,000 Visitors) x 100 = 3% Conversion Rate
Boom. That 3% is now a concrete baseline. It gives the marketer a clear picture of how effective the page is at turning visitors into leads. Now, they can start testing new headlines, changing the call-to-action button color, or tweaking the form fields to see if they can nudge that number higher. It turns a vague goal like “get more leads” into a measurable, actionable challenge.
How to Calculate Your Sales Team’s Conversion Rate
Conversion rate isn’t just a fancy metric for marketers to obsess over in their analytics dashboards. For a sales team, it’s a direct measure of your efficiency—it tells you how good your reps are at turning genuine interest into actual revenue.
But here’s where a lot of teams get it wrong. They throw every single lead into the same bucket, and that just doesn’t work.
MQLs vs. SQLs: Know the Difference
You have to draw a clear line between two types of leads. A Marketing Qualified Lead (MQL) is someone who’s interacted with your marketing, maybe by downloading an ebook or signing up for a webinar. They’re curious, but not necessarily ready to buy.
A Sales Qualified Lead (SQL), on the other hand, is the real deal. Your sales team has vetted this person and confirmed they have a legitimate interest and are ready for a direct sales conversation.
If you use MQLs to calculate your sales conversion rate, your numbers will look terrible. It’s like judging a chef based on how many people walked past their restaurant instead of how many people actually sat down to eat. You need to focus on the leads your team has actually engaged with.
The Right Way to Do the Math
To get a true picture of your team’s performance, the formula has to be built exclusively on SQLs. These are the leads your reps have poured their time and energy into. Anything else just skews the data.
The calculation itself is pretty simple. You just divide the number of deals you closed by the number of SQLs your team handled over a specific period.
(Total Closed Deals / Total Sales Qualified Leads) x 100 = Sales Conversion Rate %
This approach gives you a crystal-clear view of how effective your team really is.
Let’s say your team handled 200 SQLs last month and closed 50 of them. Your sales conversion rate would be (50 ÷ 200) × 100 = 25%. Simple as that. You can find more examples of how to track this on Salesforce.com’s sales analytics page.
Keeping a close eye on this metric helps you answer some critical questions:
- Are we qualifying leads correctly?
- Which lead sources are giving us the best opportunities?
- Where are deals falling through in our sales process?
Once you start answering these questions, you can begin making smart, targeted improvements. For more hands-on strategies, take a look at our complete guide to improving your sales conversion rate. After all, a higher conversion rate means you hit your revenue targets with fewer leads, making every single effort count.
Understanding What a Good Conversion Rate Looks Like
So, you’ve calculated your conversion rate. The big question now is, “Is my number any good?”
The honest answer? It depends. A “good” conversion rate isn’t some magic number you can pull out of thin air. It’s a moving target that shifts based on your industry, how much your products cost, and even what device your customers are using to browse.
Think about it this way: a 1% conversion rate could be fantastic for a high-end furniture store selling $5,000 sofas. But a 10% rate for a free e-book download? That might actually be underperforming. Context is everything.
Benchmarks Are a Guide, Not a Rule
Different industries have wildly different averages. For instance, B2B blogs often see conversion rates hovering between 1% and 3%. On the other hand, eCommerce product pages can hit anywhere from 2% to 10%.
These numbers give you a decent starting point, but they shouldn’t be your end goal. For a more granular look, check out these detailed eCommerce conversion rate benchmarks to see how you stack up against the competition.
The infographic below gives a great visual of how this plays out in a simple sales funnel.
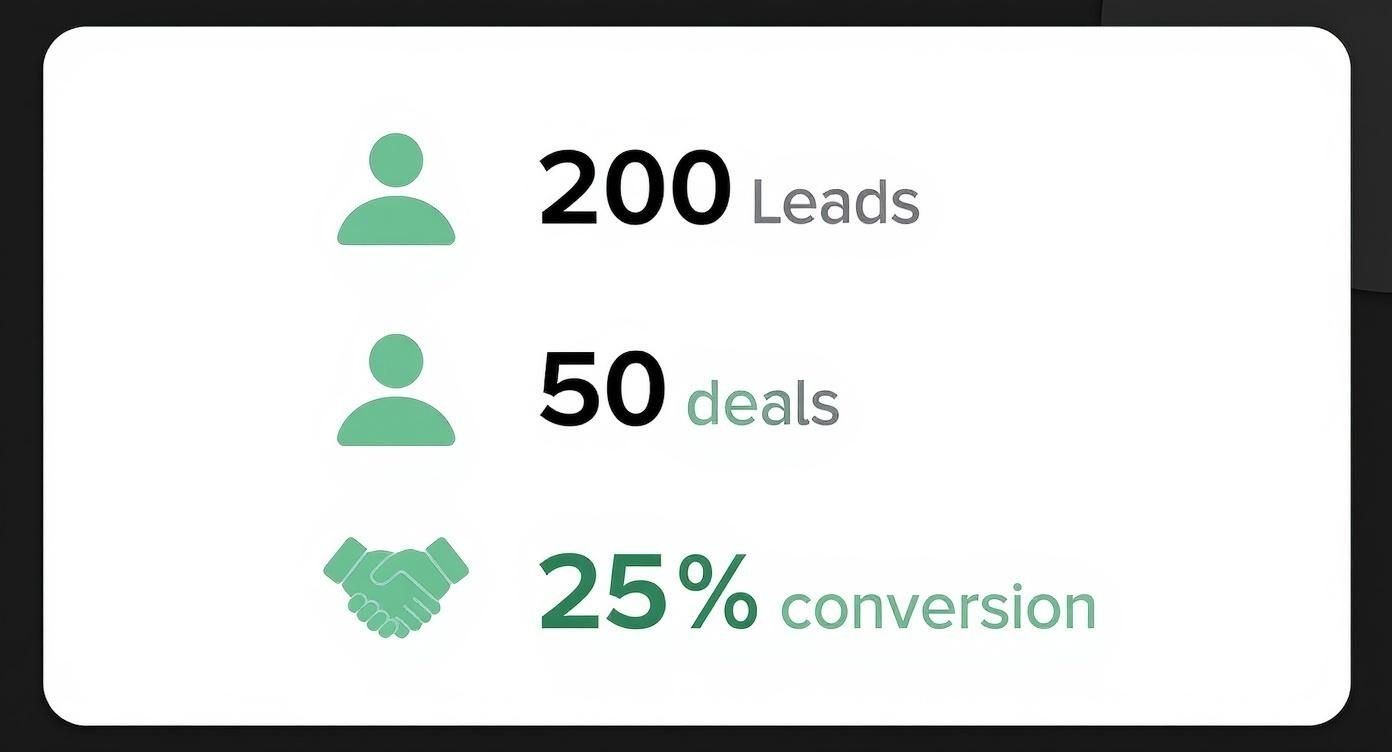
Here, we see 200 leads turning into 50 deals. That’s a 25% sales conversion rate—a really strong performance that turns a quarter of qualified leads into paying customers.
To give you a broader perspective, here’s a quick look at how conversion rates can vary across different sectors.
Industry Conversion Rate Benchmarks
While your own data is king, it’s still helpful to know the general lay of the land. This table shows some typical conversion rates for both e-commerce sales and lead generation across various industries.
| Industry | Average E-commerce Conversion Rate | Average Lead Gen Conversion Rate |
|---|---|---|
| Fashion & Apparel | 1% – 3% | 4% – 6% |
| Electronics | 1% – 2% | 3% – 5% |
| Food & Beverage | 3% – 5% | 5% – 8% |
| Health & Wellness | 2% – 4% | 6% – 9% |
Use these figures as a rough guide to see where you stand, but don’t get too hung up on matching them exactly. Your business is unique, and so are your customers.
The most powerful benchmark you have is your own historical data. Your primary objective shouldn’t be to match an industry average but to consistently improve your own baseline performance month over month.
Focus on beating your numbers from last month. This simple shift in mindset turns conversion tracking from a passive measurement into a powerful tool for growth. It guarantees you’re always moving forward and fine-tuning your funnel for your specific audience.
Don’t Just Count Conversions—Measure How Long They Take
A high conversion rate is great news, but it’s really only half the story. If you want the full picture of how your customers behave, you need to ask a follow-up question: how long did it take for them to convert?
This is where tracking time to conversion comes in. It’s a simple but powerful metric that measures the clock between a person’s very first interaction with your brand and the moment they finally buy, sign up, or take whatever action you’re aiming for.
Think about it: a short conversion time usually means you’ve created a slick, efficient user experience. A longer one might point to some friction in your funnel or simply show that you’re selling something that requires a bit more thought before purchase.
Either way, understanding this timeframe is the key to fine-tuning your entire strategy.
Why This Metric Is a Game-Changer
When you only look at your conversion rate as a static number, you’re missing out on some seriously valuable context. The average time it takes a prospect to convert after that initial contact reveals so much. Quick conversions often point to a streamlined, persuasive customer journey. Slower ones? They might be flagging barriers or weak points in how you’re engaging people.
For a deeper dive into conversion metrics, the folks over at OpenViewPartners.com have a great guide.
Here’s what this data helps you do:
- Pinpoint where customers get stuck so you can optimize your marketing funnels.
- Understand the natural decision-making timeline for your products, which helps refine your sales cycle.
- Create way more accurate revenue forecasts by factoring in the typical lag time between interest and purchase.
Let’s say you notice that shoppers who get an abandoned cart SMS almost always convert within 24 hours. But people who see a social media ad? They take about a week. That single piece of information tells you exactly how to tailor your follow-up strategies and where to put your ad budget for the best results.
Knowing when people convert is just as important as knowing that they convert. By measuring time to conversion, you stop just counting your wins and start understanding the rhythm and flow of your customer journey. That’s how you make smarter, more timely moves that actually drive growth.
Frequently Asked Questions
When you start digging into conversion rates, a few questions always seem to pop up. It’s totally normal. Getting the small details right is what separates good data from great data.
Let’s walk through some of the most common sticking points so you can track your store’s performance like a pro.
What Is the Difference Between Conversion Rate and CTR?
This one trips up a lot of people, but it’s pretty simple when you break it down.
Click-through rate (CTR) is all about that initial spark of interest. It tells you how many people saw your ad, link, or subject line and thought, “Hey, I’ll click on that.” It’s a fantastic way to measure how well your copy or creative is grabbing attention.
Conversion rate, on the other hand, is the main event. It tracks how many of those visitors actually followed through and did the thing you wanted them to do—like buying a product or signing up.
In short, CTR measures curiosity, while conversion rate measures commitment. One tells you who clicked, the other tells you who actually bought.
Should I Calculate Conversion Rate Based on Users or Sessions?
Ah, the classic “users vs. sessions” debate. The truth is, there’s no single right answer here—it all boils down to what you’re trying to measure.
- By Users: Calculating by unique users is perfect if you want to know how many individual people converted. This is the go-to metric for things like lead generation, where one person usually only signs up once.
- By Sessions: In e-commerce, calculating by sessions is often more insightful. A single shopper might pop onto your site a few times (creating multiple sessions) before finally pulling the trigger. This method helps you understand how effective each visit is at pushing them toward a purchase.
The most important thing? Pick the method that makes the most sense for your business goals and then stick with it. Consistency is key for accurate tracking over time.
How Can I Improve My Conversion Rate?
Getting more people to convert is the name of the game. The whole practice is called Conversion Rate Optimization (CRO), and it’s all about finding and fixing the little points of friction that stop customers from clicking “buy.”
Instead of a massive overhaul, focus on small, impactful changes. Here are a few areas that almost always yield results:
- A/B test everything. Seriously. Test your headlines, your product images, your button colors, your calls-to-action. You’d be amazed what a simple tweak can do.
- Make your checkout ridiculously simple. The more steps, the more chances you give someone to bail.
- Show, don’t just tell. Use social proof like customer reviews, ratings, and testimonials to build trust right on the product page.
- Speed is everything. Make sure your site is blazing fast and works flawlessly on mobile. Nobody waits for a slow-loading page anymore.
Ready to turn those abandoned carts into revenue? CartBoss uses automated SMS to bring customers back and recover lost sales on autopilot. Start boosting your sales today at https://www.cartboss.io.