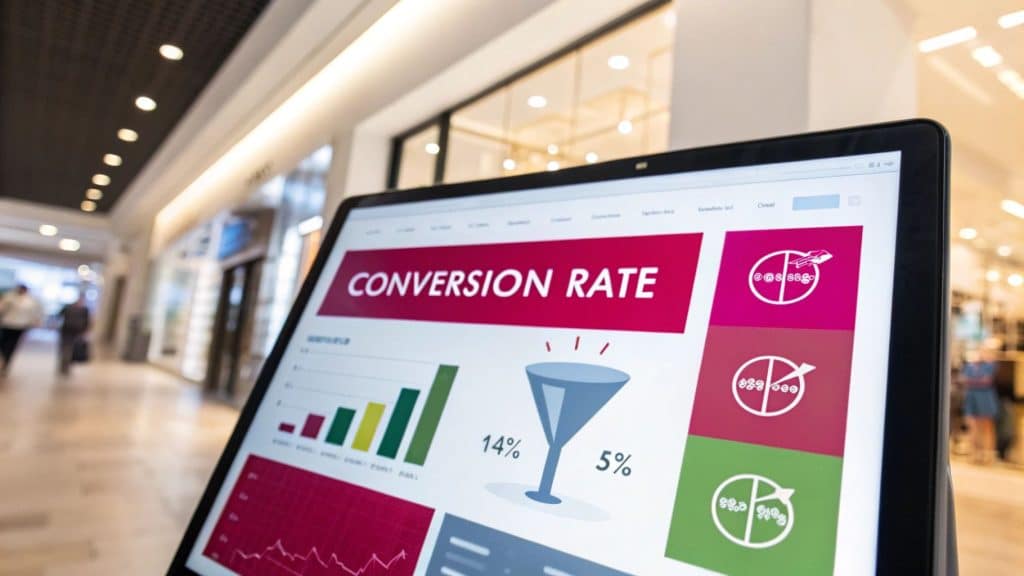
In simple terms, your conversion rate is the percentage of visitors who do what you want them to do on your website. Think of it as a scorecard. It tells you how good your site is at convincing people to take action, whether that’s buying a product, signing up for your newsletter, or downloading a guide.
It’s one of the most fundamental metrics for figuring out if your digital marketing is actually working.
Defining Conversion Rate for Your Business

Picture your website as a brick-and-mortar store. Thousands of people might walk by your window (that’s your traffic), and hundreds might step inside to look around (those are your visitors). But the conversion rate tells you what percentage of those browsers actually pulled out their wallets and bought something.
This single number turns abstract traffic data into a crystal-clear measure of performance. And it’s not just about sales. A “conversion” can be any action you deem valuable, and knowing this is the key to using this metric to hit your specific business goals.
What Counts as a Conversion?
A conversion can be almost anything you decide is a win for your business. These actions typically fall into two buckets:
- Macro-conversions: These are the big ones, the primary goals that are often tied directly to your bottom line. Think making a purchase, requesting a quote, or starting a free trial.
- Micro-conversions: These are the smaller, but still important, steps a visitor takes on their way to a bigger goal. This could be signing up for an email list, creating an account, or even just adding an item to their cart.
By tracking both, you get a much richer story of how users are engaging with your site. To really get into the “why” behind these actions, you can explore concepts like what is behavioral analytics to uncover the patterns driving user choices.
Key Takeaway: Your conversion rate is the ultimate indicator of your website’s persuasiveness. A high rate means your messaging, design, and user experience are all working together to guide visitors toward a specific goal.
To make it even clearer, let’s break down the core components that make up this powerful metric. The simple table below shows how each piece fits into the puzzle.
Key Components of Conversion Rate at a Glance
| Component | Description | Example |
|---|---|---|
| Visitors | The total number of unique individuals who visit your website or a specific page during a set period. | 10,000 people visited your product page in May. |
| Conversions | The number of visitors who completed the specific goal you are tracking. | 200 of those visitors made a purchase. |
| Calculation | The mathematical formula used to determine the rate. | (200 Conversions / 10,000 Visitors) * 100 |
Ultimately, these components come together to give you a single, powerful percentage that cuts through the noise and tells you what’s really working on your site.
How to Calculate Your Conversion Rate Accurately
Knowing what a conversion rate is in theory is one thing, but calculating it for your own business is where the real magic happens. The good news? The math itself is surprisingly simple. It’s how you turn raw traffic numbers into a metric that tells you what’s really working.
But before you start punching numbers into a calculator, you need to be crystal clear on what you’re actually measuring. As we’ve talked about, a “conversion” isn’t just about the final sale. It’s any meaningful action a visitor takes that inches them closer to becoming a customer.
Defining that action is the most important first step. You can’t measure success if you haven’t defined what it looks like for a specific page or campaign.
Defining Your Specific Conversion Goal
So, what do you want visitors to do? Your answer to that question is the “conversion” you’ll be tracking. Different pages on your site will have different goals, and that’s perfectly fine.
Here are a few common conversion goals you might track:
- Making a purchase: The holy grail for any e-commerce store.
- Submitting a form: This could be for a lead magnet, a quote, or just a simple contact form.
- Signing up for a newsletter: A classic micro-conversion that helps you build an audience.
- Downloading a resource: Think PDF guides, case studies, or free e-books.
- Starting a free trial: A make-or-break goal for SaaS and subscription businesses.
Once you’ve locked in your goal, you just need one other piece of the puzzle: the total number of visitors to the page or site where that action can happen. Knowing how to analyze website traffic correctly is key to getting this number right.
The Conversion Rate Formula
The formula for figuring out your conversion rate is refreshingly straightforward. It’s just simple division, multiplied by 100 to get a clean percentage.
Conversion Rate = (Total Number of Conversions / Total Number of Visitors) x 100
This little formula tells you exactly what percentage of people who had the chance to convert actually followed through. Let’s run through a couple of real-world examples to see it in action.
Practical Calculation Examples
Applying the formula to your own data makes the concept click. Whether you’re selling t-shirts or generating leads for a service, the math is the same.
Example 1: E-commerce Store
Let’s say your online store had 10,000 visitors last month. During that same time, you made 200 sales.
- Divide Conversions by Visitors: 200 sales / 10,000 visitors = 0.02
- Multiply by 100: 0.02 x 100 = 2
Your e-commerce conversion rate for the month was 2%. Simple. This means for every 100 people who browsed your store, two of them bought something.
Example 2: B2B Service Website
Now, imagine your B2B company ran an ad campaign that sent 2,000 visitors to a “Request a Demo” landing page. Out of those visitors, 50 people filled out the form.
- Divide Conversions by Visitors: 50 demo requests / 2,000 visitors = 0.025
- Multiply by 100: 0.025 x 100 = 2.5
The conversion rate for that specific landing page was 2.5%. This gives you a precise measure of how persuasive that page was. By using this formula consistently, you can track the impact of any changes you make, from tweaking a headline to a full redesign.
Why Conversion Rate Is a Vital Business Metric
Knowing how to calculate your conversion rate is the first step, but the real magic happens when you understand why it’s such a big deal.
Think of it this way: your conversion rate is one of the most honest indicators of your store’s health. It cuts through the noise and answers the most important question: are people actually doing what you want them to do on your site?
A strong conversion rate means more than just sales. It’s a sign that your entire customer experience—from the ad they clicked to the final checkout button—is seamless. It tells you your message is hitting the mark, your products are compelling, and you’ve built enough trust to turn a casual browser into a paying customer.
Driving Profitability Beyond Just Traffic
It’s easy to fall into the trap of thinking more traffic is the only way to grow. While bringing visitors to your site is obviously important, just throwing money at ads can be a fast track to burning through your budget. Improving your conversion rate is often a much smarter, more sustainable path to growth.
Let’s look at a quick example. Imagine two online t-shirt shops, Store A and Store B.
- Both stores spend $1,000 on Facebook ads and get 10,000 visitors.
- Store A has a clunky website and a confusing checkout, leading to a 1% conversion rate.
- Store B offers a smooth, user-friendly experience and achieves a 3% conversion rate.
With the same ad spend and traffic, Store A makes 100 sales (1% of 10,000). But Store B? They walk away with 300 sales (3% of 10,000). That’s three times the revenue from the exact same investment. This shows how a better conversion rate directly multiplies the value of every single visitor.
By optimizing what you already have, you can dramatically increase your return on investment (ROI) without spending an extra dime on ads. It’s about working smarter, not just spending more.
A Diagnostic Tool for Your Business
Beyond pure profit, your conversion rate is an incredible diagnostic tool. It’s a health check that helps you find the friction points in your customer journey and figure out what’s going on in your visitors’ minds.
Did your conversion rate suddenly tank? It could be a technical bug, like a broken payment gateway. Is one landing page consistently underperforming? Maybe its message doesn’t line up with the ad that brought people there.
Watching this number lets you move from guesswork to data-backed decisions. You can stop wondering where the problems are and start focusing your energy on the fixes that will actually move the needle. Of course, it’s just one piece of the puzzle; you need to monitor a full suite of ecommerce metrics to track to get the complete picture.
Understanding Channel Performance
Not all traffic is created equal. Your conversion rate is the key to understanding which of your marketing channels are pulling their weight and delivering high-quality visitors.
The data doesn’t lie. Paid search ads (PPC), for instance, often convert at an average rate of 3.75%, which is a solid jump over the typical 2.5% for organic search traffic. Even better, a well-run email marketing campaign can hit conversion rates close to 14%. You can dig into more of these marketing channel benchmarks on TradingEconomics.
This is gold. If you know your email list converts way better than your social media ads, you know exactly where to invest your time and money. It allows you to double down on what’s working and rethink the channels that are falling flat, making sure every dollar in your marketing budget works as hard as it possibly can.
What a Good Conversion Rate Looks Like
One of the first questions every store owner asks is, “What’s a good conversion rate?” The honest—and sometimes frustrating—answer is: it depends. There’s no magic number that works for everyone. What’s considered fantastic in one industry might be a huge red flag in another.
Think of it like a batting average. A .300 is stellar in the major leagues, but that same number would be a letdown for a local tee-ball star. Context is everything. To really gauge your performance, you have to stop chasing a universal “good” number and start looking at what’s normal for your specific situation.
This chart drives the point home, showing a simple comparison between two stores. One has a solid conversion rate, the other doesn’t. The impact on the bottom line is crystal clear.
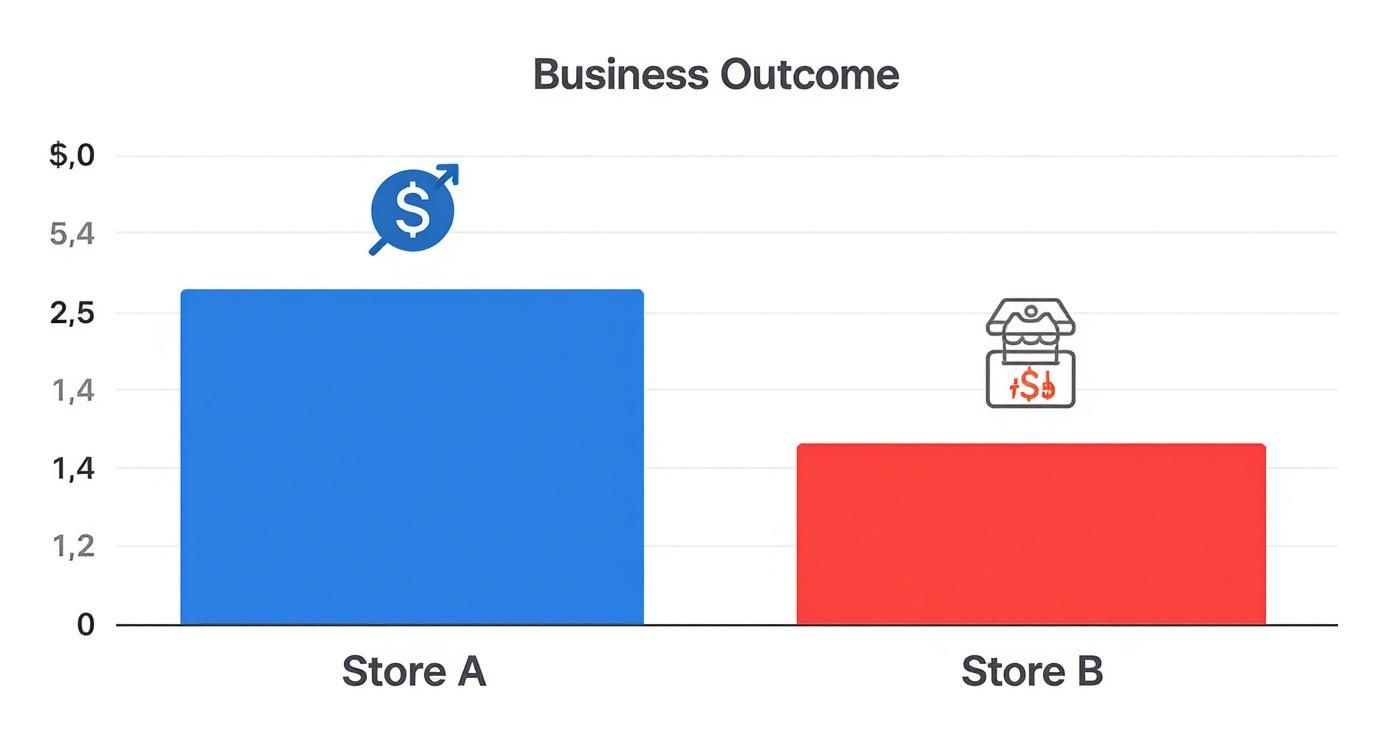
Even with the exact same amount of traffic, the store that turns more visitors into customers walks away with significantly more profit. It’s that simple.
Industry Benchmarks Matter Most
The biggest piece of the puzzle is your industry. A person’s mindset when shopping for a new car is worlds apart from when they’re ordering a late-night pizza, and conversion rates reflect that reality.
For instance, the average global e-commerce conversion rate hovers around 2.86%. But that average gets pulled in all sorts of directions by different sectors. The finance and insurance world often sees higher rates of 5-6% because people are making high-intent searches. On the other hand, the travel industry, with its long research phases and constant comparison shopping, might only see rates around 1.5%.
To give you a clearer picture, here’s a look at how different industries and devices typically perform.
Average Conversion Rates by Industry and Device
| Industry / Device | Average Conversion Rate (%) | Key Factors |
|---|---|---|
| Finance & Insurance | 5% – 6% | High-intent, need-based searches; trust is crucial. |
| Food & Beverage | 4% – 5% | Often repeat purchases, impulsive buys, and local searches. |
| Fashion & Apparel | 2% – 3% | Highly visual, trend-driven; lots of browsing and comparison. |
| Travel & Hospitality | 1% – 2% | Long consideration phase, complex booking process, high price point. |
| Desktop Users | ~3.4% | Larger screens and easier navigation make checkout feel safer and simpler. |
| Mobile Users | ~1.8% | Smaller screens and clunky forms can increase friction and cart abandonment. |
This table shows why comparing your 2.5% rate to a financial services company’s 6% is like comparing apples to oranges. The only benchmarks that truly matter are the ones for your specific field.
The Great Divide Between Desktop and Mobile
Another crucial factor is the device your visitors are using. It’s no secret that people love to browse on their phones but often switch to a bigger screen to make the final purchase. This behavior creates a consistent performance gap.
Data shows time and again that desktop users convert at a much higher rate. This isn’t a coincidence; it reflects the challenges of the mobile experience. Fiddly forms on small screens and security worries can all add friction to the checkout process.
- Desktop Conversion Rate: Averages around 3.4%. The larger screen and familiar keyboard make it easier to fill out forms and enter payment details with confidence.
- Mobile Conversion Rate: Hovers around 1.8%. While most shopping journeys start here, the path to purchase can be clunky, leading to more abandoned carts.
This gap actually represents a huge opportunity. Even small tweaks to your mobile checkout flow can lead to major gains in your overall conversion rate.
How Traffic Source Influences Conversions
Where your visitors come from has a massive impact on whether they’ll buy. A user who clicks a hyper-targeted ad for a specific product has a completely different mindset than someone who stumbles onto your blog from a generic Google search.
Understanding the intent behind each traffic source is key:
- Paid Search (PPC): These visitors often have high purchase intent. They searched for a solution, and your ad promised to deliver it, leading to strong conversion rates.
- Organic Search (SEO): This traffic can be a mixed bag. Someone searching “best running shoes for flat feet” is far more likely to buy than someone searching “how to tie running shoes.”
- Email Marketing: This is frequently the highest-converting channel. You’re talking to a warm audience of subscribers who already know and trust your brand.
- Social Media: This varies wildly. Traffic from a Pinterest product pin might convert well, whereas visitors from a general Facebook post are probably just browsing.
By digging into your conversion rates by channel, you can figure out which sources bring in the most valuable traffic and spend your marketing budget more wisely. Setting realistic goals means you need a detailed view, and you can get one by exploring these e-commerce conversion rate benchmarks that break down performance by source. This nuanced approach helps you set achievable targets and know what success really looks like for your store.
Actionable Strategies for Improving Conversion Rates

Knowing what a conversion rate is and why it matters is a great start. But the real magic happens when you start actively improving it. This process is called Conversion Rate Optimization (CRO), and it’s a mix of art and science that focuses on one simple goal: turning more of your visitors into customers.
Forget looking for a single magic bullet. CRO is all about making a series of smart, methodical improvements to smooth out the customer journey. Every little tweak can add up to a big impact on your bottom line. It all comes down to making it as easy and inviting as possible for a visitor to say “yes.”
Optimize Your Landing Pages
Your landing page is often the first real handshake a potential customer has with your brand. It’s where the conversion journey kicks off, so it needs to be perfectly tuned to guide people toward taking action.
A powerful landing page always starts with a compelling headline that matches the promise from the ad or link that brought them there. That simple alignment tells visitors they’re in the right place. From there, your copy should be clear, concise, and all about the benefits—not just a list of features.
But the most important piece of the puzzle is your Call-to-Action (CTA). Make that button stand out visually, use action-focused words like “Get My Free Quote” instead of a boring “Submit,” and place it right where someone is ready to make a decision.
Streamline The Checkout Process
Cart abandonment is the arch-nemesis of every e-commerce store. A clunky, confusing, or untrustworthy checkout is one of the top reasons people bail right before they buy. The mission here is ruthless simplicity.
To combat this, try these proven tactics:
- Offer a Guest Checkout: Forcing people to create an account is a major roadblock. In fact, 24% of shoppers will ditch their cart if a site demands they create an account.
- Minimize Form Fields: Only ask for what you absolutely need to process the order. Every extra box is another reason for someone to give up and leave.
- Show a Progress Bar: Let customers see exactly where they are in the process (e.g., Shipping, Payment, Review). It manages their expectations and keeps them from feeling lost.
Making that final step as smooth as possible can save a shocking number of sales from slipping away. If you’re looking for even more ideas, check out these proven conversion rate optimization tips for extra strategies.
Key Insight: Think of your checkout as the final sprint in a marathon. You wouldn’t want to trip on a shoelace right before the finish line. Remove every possible obstacle to ensure a smooth finish for your customers.
Build Trust With Social Proof
In the online world, trust is currency. People are naturally wary of buying from a brand they’ve never heard of. This is where social proof comes in—it’s the simple idea that people look to others to figure out the right way to act. You can put this psychology to work for you.
Make sure you’re showing off evidence that other people have had great experiences with your brand. This can include things like:
- Customer Reviews and Testimonials: Nothing beats genuine feedback from real people. It’s incredibly powerful.
- Trust Badges: Displaying logos for secure payment options (like PayPal or Visa) or other security seals can instantly put minds at ease about data safety.
- User-Generated Content: Showing pictures of actual customers using your products adds a layer of authenticity that stock photos just can’t compete with.
Embrace A/B Testing
So, how do you know if changing your CTA button from blue to green will actually do anything? You test it. A/B testing, also known as split testing, is the heart and soul of CRO.
It’s pretty straightforward: you create two versions of a webpage (Version A and Version B) and show each one to a different group of visitors. By tracking which version gets more conversions, you can make decisions based on cold, hard data instead of just a gut feeling.
You can test almost anything—headlines, images, page layouts, special offers, you name it. This scientific approach is what ensures every change you make is a genuine step forward. For a deeper dive, explore these actionable conversion rate optimization (CRO) tips that cover everything from testing basics to advanced personalization.
The slow-but-steady climb of e-commerce effectiveness over the years is a direct result of these optimization efforts. Back in the early 2000s, conversion rates were often stuck below 1%. By 2010, better design and faster internet helped push the average to around 2%, with data showing an average incremental increase of 0.2% year-over-year thanks to these data-driven strategies.
Answering Your Top Questions About Conversion Rates
Once you start digging into conversion rates, a few questions always seem to pop up. It’s only natural. Let’s tackle some of the most common ones so you can move forward with confidence.
Think of this as your quick-reference guide for navigating the practical side of things as you begin tracking and improving this all-important metric.
What’s the Difference Between Conversion Rate and Click-Through Rate (CTR)?
It’s incredibly easy to mix these two up, but they measure two very different—though equally important—parts of the customer’s journey.
Imagine your online store is a physical shop on a busy street.
Click-Through Rate (CTR) is all about initial interest. It tells you what percentage of people who saw your “store window” (your ad, email, or search result) were intrigued enough to step inside. It answers the question: “Is my message compelling enough to get a click?”
Conversion Rate, on the other hand, measures the final, decisive action. It tells you what percentage of those people who came inside your store actually bought something. It answers a much more critical question: “Was the experience good enough to close the deal?”
In short, CTR gets them in the door; conversion rate turns them into a customer. A high CTR with a low conversion rate is a classic sign of a problem on your landing page.
How Often Should I Check My Conversion Rate?
There’s no single right answer here—it really depends on how much traffic your website gets. But we can break it down into a simple guideline.
- High-Traffic E-commerce Sites: If you’re getting thousands of visitors a day, checking your conversion rate weekly is a solid plan. This lets you spot trends, see the impact of promotions, and catch technical glitches without overreacting to the normal daily ups and downs.
- Lower-Traffic or Niche Sites: If your site has less traffic, a monthly review is often far more meaningful. Daily or even weekly numbers can be skewed by small sample sizes, making it tough to see the big picture. Checking monthly gives you a more stable baseline to work from.
The key is to focus on trends over time, not obsessing over small, day-to-day spikes. It’s also smart to align your check-ins with your marketing campaigns to measure their direct impact.
My Conversion Rate Is Low. What Should I Do First?
Seeing a low conversion rate can feel like a punch to the gut, but it’s actually a huge opportunity. Before you start A/B testing button colors or rewriting headlines, your first job is to play detective.
Don’t guess—investigate. Start by figuring out where visitors are dropping off. Tools like Google Analytics or heatmaps can show you exactly which pages have high exit rates or where people stop scrolling. Is everyone leaving from one specific product page? Are they abandoning carts when they see the shipping costs?
Here’s a simple diagnostic checklist to run through first:
- Run a Technical Check: Cover the basics. Is your site loading slowly? Are there broken links? Does the checkout actually work on a phone? Sometimes, the fix is a simple technical glitch.
- Analyze User Behavior: Use your analytics to find the friction. Look for pages with unusually high bounce rates—that often signals a mismatch between your ad and your landing page.
- Get Direct Feedback: Just ask! Use simple on-site surveys or polls to ask visitors why they didn’t buy. You might be surprised by what they tell you.
Once you’ve found the most likely problem area, then you can start testing specific solutions.
Ready to stop losing sales to abandoned carts? CartBoss turns those lost opportunities into profit on autopilot. Our powerful SMS cart recovery tool is designed to re-engage customers and boost your revenue by up to 50% without any manual work. Start recovering lost sales today at https://www.cartboss.io.