


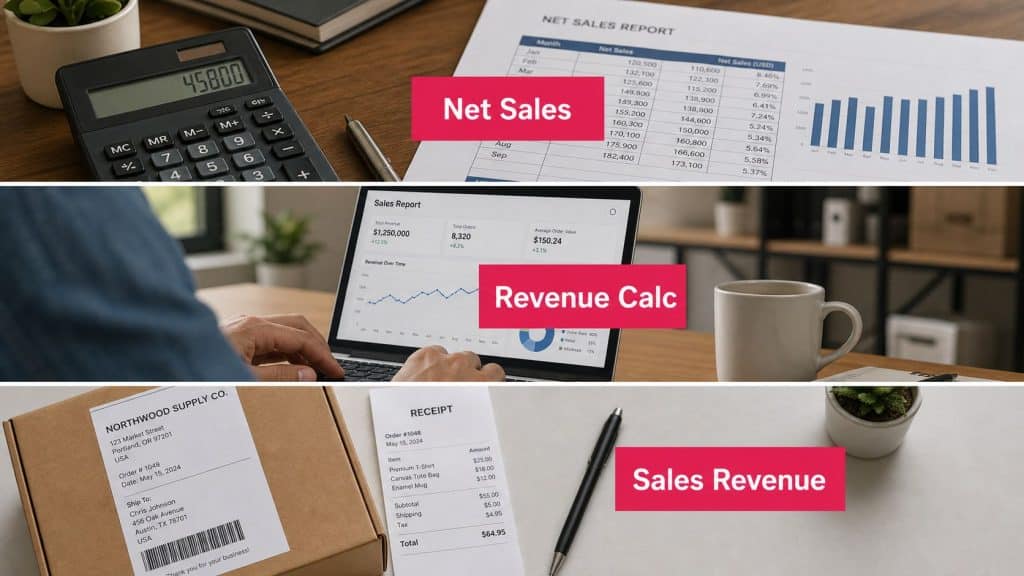
Your dashboard can look healthy while the P&L tells a quieter story. Gross sales are usually the loudest number in the room, but they don’t tell you what customers paid you to keep after returns, allowances, and discounts hit the books. A net sales revenue calculator gives you the number that survives those frictions, which is the one finance teams can trust for reporting, forecasting, and margin conversations.

What Net Sales Revenue Measures
Most store owners live in their gross sales number because it looks clean and exciting. Then the returns come in, a few promos get stacked, and a handful of allowances get issued after shipping complaints or product issues. Net sales is the figure left over after those deductions, and that is the number that tells you what the business kept from customers.
The distinction matters because gross sales is the pre-deduction total, while net sales sits lower down the income statement before profit is calculated. Net sales is not profit, because it does not subtract cost of goods sold, operating expenses, or taxes. A finance-safe way to read the two figures is simple, gross sales shows demand, net sales shows realized revenue. The same accounting logic is used in standard formulas such as Net Sales = Gross Sales − Sales Returns − Sales Allowances − Sales Discounts (TextMagic).
Why the distinction matters in e-commerce
In e-commerce, the gap between the two numbers can get ugly fast. Returns, coupon stacking, and post-purchase credits can turn a strong-looking top line into a much smaller revenue base. A calculator setup only helps if it mirrors what reaches the ledger, which is why a net sales calculator template for store KPIs should track each deduction bucket separately instead of burying everything in one adjustment.
A useful way to judge the size of the gap is to compare gross sales against the deductions that follow the order. If a store counts paid orders, then later absorbs refunds and discounts, the gross number will overstate what was kept. That is the part operators feel in planning meetings, because pricing, promo cadence, and retention spend all change once the actual revenue base is visible.
Practical rule: If you are making pricing, retention, or channel decisions from gross sales alone, you are probably overestimating what the store really earned.
For attribution work, the cleaner your sales figure, the cleaner your marketing math. If you are reconciling revenue against channel spend, the attribution tips for marketing ROI framework is useful because it separates revenue quality from revenue volume. Gross sales can make a channel look louder than it really is, while net sales shows what survived the friction.
The Net Sales Formula Broken Down Step by Step

A clean net sales revenue calculator starts with one basic question, what stayed on the books after the order settled. The formula is mechanical: Net Sales = Gross Sales − Sales Returns − Sales Allowances − Sales Discounts. Gross sales starts as unit price × units sold before any deductions are applied (best-calculators).
What each line item means
Gross sales is the full sales total before customer-related adjustments. In practice, that means adding up invoice or POS sales for the period you are measuring, whether that is a month, quarter, or year (kayako). Sales returns are the value of items sent back after the sale. Sales allowances are credits issued when you keep the sale but reduce the amount because something was not right. Sales discounts are price cuts applied at checkout or after the fact.
The useful part is separating those deductions instead of folding them into one catch-all number. That makes it easier to spot double-counting, especially when an order gets both a line-item discount and an invoice-level promo. A practical workflow is to calculate gross sales first, enter returns, allowances, and discounts on separate lines, then reconcile the result against the ledger so timing or classification errors do not slip through (a-systems).
The spreadsheet does not need to be clever. It needs to be obvious enough that a tired finance manager can trace every number back to a transaction.
If you already track order economics, the logic lines up with how to calculate average order value. One metric shows what buyers spend per order, the other shows what survives deductions after those orders settle.
For audit and revenue-recognition work, returns and allowances need careful treatment because they change recognized revenue, not just the presentation on a report. The Jumpstart Partners discussion on revenue recognition for audits is useful if your books need tighter control around adjustments.
Worked Examples for a General Business and an Online Store
A formula only matters when the numbers look like yours. One of the easiest ways to test a net sales revenue calculator is to run the same logic through a stable business case and then through an e-commerce case where returns and discounts get messy fast.
General business example
Use the published benchmark example as the baseline. Start with $500,000 in gross sales, subtract $25,000 in returns, $10,000 in discounts, and $5,000 in allowances. That lands at $460,000 in net sales (a-systems).
| Line item | General business | E-commerce store |
|---|---|---|
| Gross sales | $500,000 | Higher gross, then adjusted down |
| Sales returns | $25,000 | Higher and more volatile |
| Sales discounts | $10,000 | Often stacked with campaigns |
| Sales allowances | $5,000 | Usually smaller, but still real |
| Net sales | $460,000 | Can fall by more than 10% in a period |
E-commerce store example
The e-commerce side is where the math stops being theoretical. As gross demand rises, deductions can move in the opposite direction, especially when promotional pricing, refunds, and post-purchase friction land in the same reporting period. The calculator example in the verified data already shows how a relatively modest set of deductions can pull gross sales down by more than 10% in one reporting period (calculatorultra).
That’s the mistake I see most often in store reporting. Teams celebrate gross orders, but the net number tells a more useful story about what survived refunds and pricing concessions. If returns are high and discounts are stacked across campaigns, the true revenue line can look very different from the dashboard.
The fastest way to sanity-check your own numbers is to break them into these buckets:
- Gross sales first. Start with transaction-level sales before any deductions.
- Returns second. Capture refunds in the period they’re recognized, not where the original order landed.
- Discounts third. Separate checkout discounts from post-purchase price adjustments.
- Allowances last. Keep customer service credits out of the returns bucket.
For a second lens on sales performance, the how to analyze sales data guide is useful because it pushes you to compare the pattern, not just the total. Net sales only becomes actionable when you can see where the deductions are coming from.
Build a Net Sales Revenue Calculator in Excel or Google Sheets
A spreadsheet is still the cleanest way to build a net sales tool that people use. The trick is to keep the inputs separate and the formula simple, so you can trace errors without digging through a maze of nested logic. A calculator built this way also makes reconciliation much easier because every deduction has its own cell.

Clean sheet layout
Use one row for inputs and one row for the result.
- Gross Sales in cell B2
- Sales Returns in cell B3
- Sales Allowances in cell B4
- Sales Discounts in cell B5
- Net Sales in cell B6
In B6, use this formula:
=B2-B3-B4-B5
That same formula works in both Excel and Google Sheets. If you want to make the sheet safer, lock the formula cell and leave only the input cells editable. That keeps someone from overwriting the calculation when they’re updating the monthly report.
Reconciliation workflow
Once the calculator is built, compare the result with the accounting ledger. The useful test is not whether the formula works, it’s whether the output matches the books. A mismatch usually means one of three things, a return landed in the wrong period, an allowance was coded like a refund, or a discount got counted twice.
Practical rule: If the spreadsheet output and ledger disagree, assume the categorization is wrong before you blame the formula.
For teams that want to connect revenue recovery to paid traffic and retention math, the return on ad spend calculator page is a good companion reference. It helps keep the revenue side and spend side in the same conversation, which is where the important decisions happen.
Using Net Sales to Evaluate Recovery and Discount Strategies
Net sales only earns its keep when it changes decisions. In e-commerce, the biggest levers are usually abandoned-cart recovery, discounting, and return policy design, because those are the places where deductions can eat the sale after the shopper already showed intent.

Recovery lifts gross sales without bloating deductions
If an abandoned-cart SMS flow brings shoppers back, it adds to gross sales before the deduction layer even starts. That’s why CartBoss’s SMS cart recovery approach is structurally clean for net sales analysis, it works on the revenue side, not by disguising the deduction side. The relevant question is whether the recovered order survives the same return and discount rules you already use for the rest of the store.
You can model this by comparing recovered orders against the discount cost of the campaign and then measuring the resulting net sales, not just the recovered order count. The more disciplined analysis is to ask whether the campaign raised the amount kept after returns and allowances, not whether it generated more dashboard noise. If you’re comparing recovery tactics, the impact of discounts and promotions on cart recovery article is a useful lens because it forces you to separate incentive from actual revenue quality.
Return policy changes deserve scenario modeling
Return-policy changes belong in the same calculator because they move deductions directly. A tighter return window, fee-based returns, or stronger fraud and chargeback controls can all shift net sales outcomes, but the effect depends on the mix of products and buyers. That’s why scenario planning matters more than generic advice.
A simple internal test is to compare a lower-return scenario against a higher-return scenario and watch the net figure move. The exact gross number won’t tell you enough on its own. The deduction profile is the story.
If you need a broader checkout lens before you change recovery flows, the guide to optimize your ecommerce checkout flow is a useful supporting read. A smoother checkout reduces the number of orders that need to be recovered later, which is often a cleaner win than trying to rescue a broken funnel after the fact.
Recovery is useful, but only if the recovered revenue still clears the deduction drag.
Common Mistakes That Break Your Net Sales Calculation
The formula is straightforward. The mistakes come from accounting judgment, timing, and sloppy categorization. I’ve seen stores with perfectly fine demand but unreliable net sales because the monthly close mixed returns, discounts, and allowances in ways that made the number impossible to trust.
The five errors that show up most often
- Period mismatches. A return gets booked in the month the order originally shipped instead of the month it was recognized. That makes the wrong period look weaker or stronger than it really was.
- Double-counted discounts. A store applies a line-item promo and then subtracts the same concession again at invoice level.
- Allowance and refund confusion. Customer service credits get coded as returns, which inflates the returns bucket and muddies the trail.
- Missed post-purchase refunds. Refunds issued after the sale never make it into the deduction line, so net sales stays overstated.
- Mixing revenue with profit. Net sales is still revenue, not profit. Costs come later in the income statement, and they’re a separate problem.
A good calculator catches these problems by design. Separate inputs force the user to classify deductions correctly, and a reconciliation step exposes anything that doesn’t match the ledger. If the figure doesn’t tie out, the issue is usually transaction timing or category assignment, not the formula itself (best-calculators, a-systems).
Quick troubleshooting checklist
- Check the date range. Make sure the report period is the same in the spreadsheet and the ledger.
- Inspect each deduction bucket. Returns, allowances, and discounts should each have their own total.
- Look for duplicate promotion codes. Stacked discounts often get counted twice by accident.
- Confirm the refund source. Post-purchase refunds need the right accounting treatment.
- Re-run the tie-out. If the ledger still differs, trace the largest adjustment first.
If the ledger and calculator still disagree after that, don’t force the number. Fix the classification, then rebuild the report. A net sales figure that looks neat but won’t reconcile is worse than no figure at all.
CartBoss helps store owners recover abandoned carts with SMS, which gives you another lever to improve the revenue side before deductions take hold. If you want to see how that fits into a practical revenue workflow, visit CartBoss and use the net sales lens to judge what recovered orders are worth.