
Figuring out your Average Order Value is pretty straightforward: you just divide your total revenue by the number of orders you received over a certain period. While the formula itself is simple, it gives you a powerful snapshot of how your customers are behaving. It tells you exactly how much the typical customer spends in a single transaction.
Why AOV Is More Than Just a Number

Think of Average Order Value (AOV) as a vital sign for your ecommerce store. The calculation is dead simple, but what it reveals is profound. It’s the starting line for building smarter, more sustainable growth.
AOV tells you exactly how much money you’re making per checkout. But its real power comes from shifting your focus away from just acquiring new customers to maximizing the value of the ones you already have.
If you’re seeing a consistently low AOV, it might mean you’re getting plenty of traffic, but customers aren’t really exploring your product catalog or grabbing complementary items. On the flip side, a rising AOV is a great sign that your merchandising, upselling, and bundling strategies are actually working.
The Strategic Importance of AOV
Once you get a handle on this metric, you can build a much more resilient and profitable business. Instead of constantly pumping money into ads to chase new visitors, you can generate more revenue from your existing traffic. This has a direct, positive impact on your return on ad spend (ROAS) and strengthens your bottom line.
AOV gives you the kind of crucial insights that should inform your biggest business decisions:
- Marketing Strategy: It helps you pinpoint which channels are bringing in the big spenders, so you can stop guessing and allocate your budget where it counts.
- Pricing and Promotions: Knowing your AOV makes it way easier to set strategic thresholds for things like free shipping or discounts that genuinely encourage larger carts.
- Customer Experience: It shines a light on opportunities to improve your website, like tweaking your product recommendations or cross-selling placements.
AOV is a powerful KPI on its own, but it becomes a true game-changer when you pair it with other metrics. For instance, understanding the customer lifetime value formula alongside AOV gives you a much richer picture of long-term profitability and customer loyalty. This combo helps you see if your efforts to increase single-purchase value are also turning into repeat business down the line.
A Practical Guide to Calculating Your AOV
Alright, let’s move from theory to practice and actually calculate your average order value with some real numbers. The basic site-wide calculation is a good starting point, but the real magic happens when you start slicing up the data.
The core formula couldn’t be simpler: Total Revenue / Total Number of Orders = AOV.
So, if your store pulled in $50,000 from 500 orders last month, your site-wide AOV is a clean $100. While that’s a nice, round number to know, it hides the most interesting stories your data is trying to tell you.
Breaking Down AOV by Segments
Real, actionable insights come from segmentation. By figuring out the AOV for different channels or customer groups, you can pinpoint what’s truly driving value for your store. This is how you learn where to double down on your marketing and where you need to optimize.
Here are a couple of critical segments you should be analyzing:
- AOV by Marketing Channel: Compare customers from your different traffic sources. Do shoppers coming from your Google Ads spend more per order than those who find you through organic search?
- AOV by Customer Type: Look at the spending habits of new versus returning customers. A significantly higher AOV from your loyal, returning customers is a fantastic sign of brand health.
For instance, you might discover that your Google Ads traffic has an AOV of $135, while your organic search traffic is hovering around $95. This immediately tells you that your ad campaigns are attracting higher-value buyers, which can easily justify the ad spend. This level of detail is a key part of learning how to analyze sales data the right way.
Key Takeaway: A single, site-wide AOV is just a vanity metric. A segmented AOV is an actionable one. It tells you who your most valuable customers are and where they’re coming from.
Putting It Into Practice with Tools
You don’t need fancy, expensive software to get started. You can easily crunch these numbers in a simple spreadsheet or pull them directly from your database.
In Google Sheets or Excel:
If your total revenue is sitting in cell A2 and your total number of orders is in B2, the formula is as basic as it gets:
=A2/B2
Using a SQL Query:
For those comfortable poking around in a database, a quick query can get you this data in seconds. To find the AOV for a specific month, you could run something like this:
SELECT
SUM(total_revenue) / COUNT(order_id) AS average_order_value
FROM
orders
WHERE
order_date >= ‘2024-05-01’ AND order_date <= ‘2024-05-31’;
This kind of hands-on approach lets you move beyond the surface-level reports and start uncovering the patterns that will genuinely guide your growth strategy.
How Your AOV Stacks Up Against Industry Benchmarks
So, you’ve calculated your average order value. The very next question on your mind is probably, “Is my AOV any good?” That’s the right question to ask. Context is everything, and stacking your number up against industry benchmarks is the quickest way to see how you’re really doing and set some realistic goals.
Knowing where you stand can uncover some serious growth opportunities. If your store’s AOV is lagging behind the industry average, it’s a huge red flag telling you it’s time to get to work on new strategies—whether that’s optimizing your marketing spend or getting smarter with your product recommendations.
Recent data shows the global AOV is climbing. As of November 2024, it hit $144.57, which is an 8.7% jump from the previous year. This tells us customers are still opening their wallets and spending more with each purchase.
Don’t forget to look at regional differences, too. They can be pretty significant. For instance, the AOV in the United States was sitting around $153 as of April 2025. This is exactly why you need to keep an eye on both global and local benchmarks to get a true sense of your performance. You can dig into more ecommerce order value insights to see how these trends are playing out across different markets.
Visualizing Your Performance Gaps
Comparing your site-wide AOV against segmented data is where the magic really happens. When you break it down by channel or customer type, you can immediately spot your winners and losers.
The chart below shows a classic scenario. You’ll often find that customers from paid ads and your loyal returning shoppers deliver much higher value than the average.
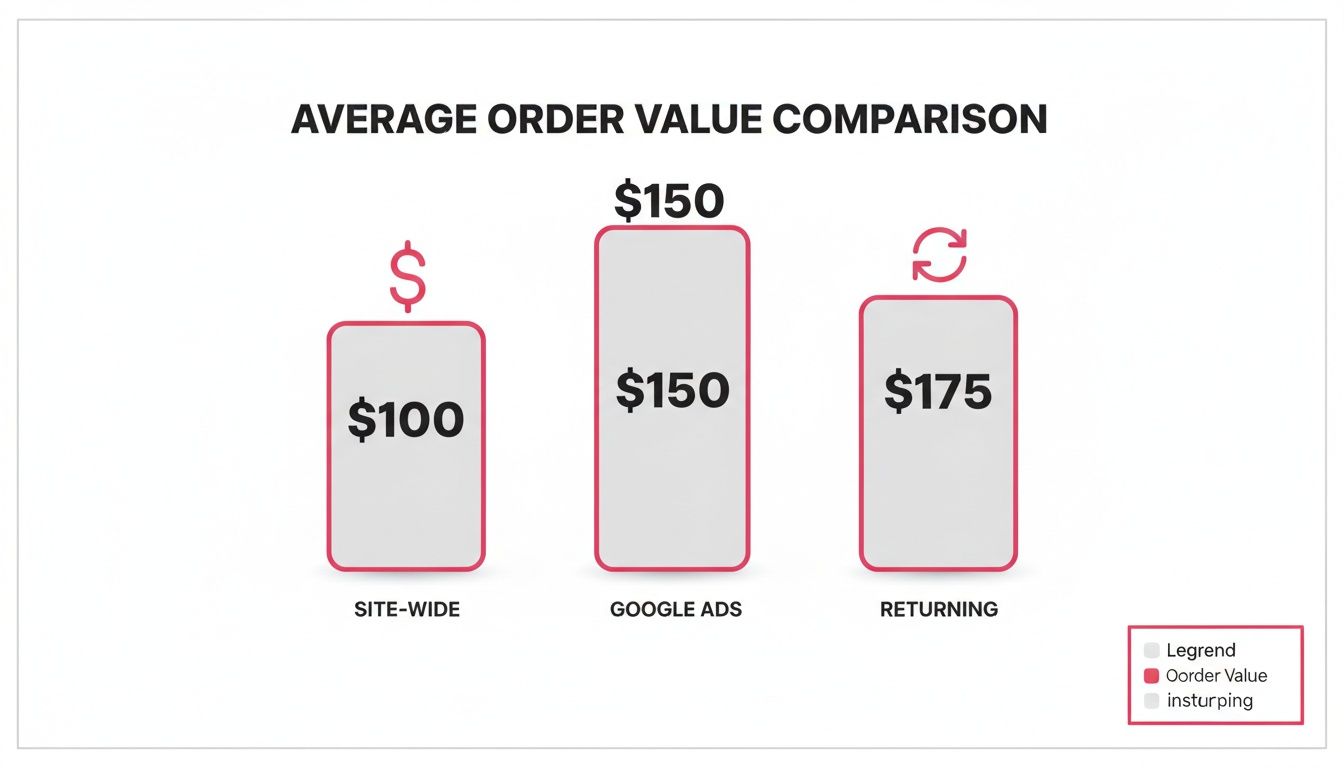
This kind of visualization makes it painfully clear. While the store’s overall AOV is $100, both Google Ads and returning customers are blowing that number out of the water. An insight like this gives you the ammo to justify your ad spend and double down on retention efforts for your best customers. These benchmarks aren’t just numbers on a screen; they’re your strategic roadmap.
Common Mistakes That Skew Your AOV Data
The Average Order Value formula looks simple enough, but getting clean, reliable data means you have to sidestep a few common traps. Even small missteps can lead to big inaccuracies, which is the last thing you want when you’re making strategic decisions based on that info.
One of the most frequent errors I see is including extra fees in your revenue calculation. A lot of businesses mistakenly lump shipping fees and taxes into their total revenue before dividing. This artificially inflates your AOV, making you think customers are spending more on products than they actually are. Your calculation should only ever reflect the value of the goods sold.
Another major oversight is failing to account for returns and refunds. Think about it: if a customer returns an item, that revenue is gone. Leaving it in your AOV calculation just paints an overly optimistic picture of your store’s performance and can easily hide potential issues with product quality or customer satisfaction.
Relying on a Single Site-Wide AOV
Maybe the single biggest mistake is looking at only one, all-encompassing AOV. A single number just papers over the cracks, hiding crucial details about your customers’ behavior.
For instance, knowing which traffic sources bring in your biggest spenders is vital for optimizing ad budgets. If you don’t know where your high-value customers are coming from, you’re just throwing money at the wall. Understanding these channel nuances is a core part of effective attribution modeling.
A blended AOV can be seriously misleading. Segmenting your data is how you find the real story behind the numbers, showing you which channels and customer groups are actually your most profitable.
Device type also has a huge influence on spending. Desktop users average $204 per order, while mobile users come in at just $137—that’s a massive 48% difference! Seasonal shifts can also cause wild fluctuations. AOV for consumer goods might drop 24% after the holidays, while fashion surges 51%. Ignoring these segments means you’re flying blind and missing out on truly actionable insights. You can find more of these kinds of nuggets in the ecommerce statistics on elementor.com.
Proven Tactics to Increase Your Average Order Value
Okay, you’ve got your AOV number. Now what? The real work begins: pushing that number higher. The good news is you don’t need to rebuild your entire business to do it. It’s all about small, smart tweaks that encourage shoppers to add just one more thing to their cart.
The beauty of focusing on AOV is that you’re working with your warmest audience—people who are already on your site with their wallets out. Your job is simply to enhance their shopping experience by helping them find even more value.
Implement Smart Product Bundling and Upsells
One of the most powerful ways to lift your AOV is through clever merchandising. Don’t just list products; think about how they fit together to solve a customer’s real-world problem.
- Product Bundles: Group complementary items into a single, discounted package. Think a “Work From Home Starter Kit” with a desk mat, laptop stand, and cable organizer. This bumps up the perceived value and makes it a no-brainer for the customer to get everything at once.
- Strategic Upselling: When someone adds an item to their cart, show them a slightly better, higher-margin version. This could be the premium edition of a skincare product or an extended warranty on an electronic gadget. The key is to make the offer genuinely useful and relevant.
Don’t just show customers what other people bought. Use their behavior to recommend products that truly complete their purchase. A low-cost, high-value add-on presented at the right moment is often an irresistible offer that nudges the AOV higher.
Set Attainable Incentives
Let’s be honest, everyone loves a good deal. A well-placed incentive can be the final push a customer needs to toss another item into their cart, giving your AOV a direct boost.
A free shipping threshold is a classic for a reason—it just works. In fact, 52% of shoppers admit to adding more items to their cart just to qualify for free shipping. A good rule of thumb is to find your most common order value and set the free shipping minimum about 30% higher. This makes it feel achievable for most of your customers.
Tiered discounts are another fantastic play. Structure them as a challenge: “Spend $75, get 10% off; Spend $100, get 15% off.” This gamifies the experience and makes the benefit of spending more crystal clear. These tactics are core to broader revenue optimization strategies that squeeze more value out of every single transaction.
To really dig into this, you can explore more proven ecommerce tactics to increase Average Order Value and find what works for your store.
Here’s a quick rundown of some effective strategies you can start testing today.
Effective Strategies to Increase Your AOV
| Strategy | Description | Example |
|---|---|---|
| Product Bundling | Grouping related products together and selling them as a single package, often at a slight discount. | Selling a camera, lens, and memory card together as a “Photographer’s Starter Kit.” |
| Upselling | Encouraging customers to purchase a more expensive, premium version of the product they are considering. | Suggesting the “Pro” version of a software with more features when a customer adds the “Basic” version to their cart. |
| Cross-selling | Recommending complementary products that pair well with the item(s) in the customer’s cart. | Showing a phone case and screen protector to a customer who is buying a new smartphone. |
| Free Shipping Threshold | Offering free shipping once a customer’s order total reaches a specific amount. | “Get free shipping on all orders over $75!” |
| Tiered Discounts | Creating discount levels that increase as the customer spends more money. | “Spend $50, get 10% off. Spend $100, get 20% off.” |
| Loyalty Programs | Rewarding repeat customers with points or exclusive benefits for their purchases. | Offering 1 point for every $1 spent, with 100 points redeemable for a $10 discount. |
Ultimately, increasing AOV is about understanding your customer’s journey and making it easy for them to discover more of what they’ll love. Test these strategies, see what your audience responds to, and watch that average order value climb.
Finding and Improving AOV in Shopify and WooCommerce
Figuring out your AOV is a lot easier when you let your eCommerce platform do the heavy lifting. Instead of messing with spreadsheets, both Shopify and WooCommerce have built-in analytics that cut right to the chase, giving you the numbers you need without the headache.
In Shopify, you’ll find your AOV right inside your Analytics dashboard. Just look for the “Total sales” report. This gives you a quick, clean overview of your store’s performance across different time frames, making it super simple to spot trends.
For those running on WooCommerce, your AOV is tucked away in the WooCommerce > Reports section. Here, you can see your net sales and the total order count, allowing you to quickly get the average for any date range you need.
Actively Boosting AOV with Integrations
Look, tracking your AOV is one thing. Actually increasing it is the real goal. This is where platform-specific apps and plugins become your secret weapon. You can stop just watching the numbers and start using smart tools to influence what customers spend at checkout.
These integrations are built to create opportunities for bigger carts without you needing to hire a developer. They plug right into your store and automate proven tactics to get customers to spend more.
Here’s what I’m talking about:
- Automated Upsells and Cross-sells: Imagine automatically suggesting a better, more expensive item or a perfect complementary product right on the product page or in the cart. It’s a classic and it works.
- Post-Purchase Offers: This is a killer tactic. You present a special, one-time offer after the customer has already paid. This removes all friction from the main checkout, making it an easy “yes” for them.
- Dynamic Cart Promotions: Things like free shipping thresholds or “spend $50, get 10% off” are powerful motivators. They give customers a clear target and a reward for hitting it, encouraging them to add just one more item to their cart.
The right app ecosystem can transform your store from a simple product catalog into a dynamic selling machine. You can find some of the best Shopify checkout apps out there that are specifically designed to drive conversions and lift your AOV with surprisingly little effort.
Common Questions About AOV
Let’s tackle some of the most common questions that pop up when stores start digging into their Average Order Value.
What Is a Good Average Order Value?
Honestly, a “good” AOV is completely relative. There’s no magic number. A luxury jewelry brand might see an AOV over $300, while a beauty store could be crushing it with an average of $45.
Instead of getting hung up on a universal number, your best bet is to benchmark against your direct competitors if you can. More importantly, the real goal is to achieve consistent, month-over-month growth in your own AOV. That’s the metric that truly matters.
Should Shipping and Taxes Be Included in the Calculation?
Definitely not. Always exclude shipping costs, taxes, and any discounts you’ve applied from your revenue total before you calculate AOV.
If you include them, you’re getting a skewed picture of what customers are actually spending on your products. You want to measure the value of the goods in the cart, plain and simple.
How Often Should I Calculate AOV?
As a general rule, tracking your AOV on a monthly basis is a great practice for spotting trends over time.
However, during critical sales periods like Black Friday or a big product launch, you’ll want to ramp that up. Checking it weekly—or even daily—during these high-stakes moments allows you to make quick adjustments to your strategy on the fly.
Ready to turn those abandoned carts into higher revenue? CartBoss uses powerful SMS campaigns to bring customers back and boost your AOV on autopilot. Learn how it works at cartboss.io.