Think of a conversion funnel as the path your visitors follow—from that very first impression all the way to clicking “Buy Now.” Imagine an inverted pyramid: broad interest at the top, gradually narrowing down to the most committed shoppers.
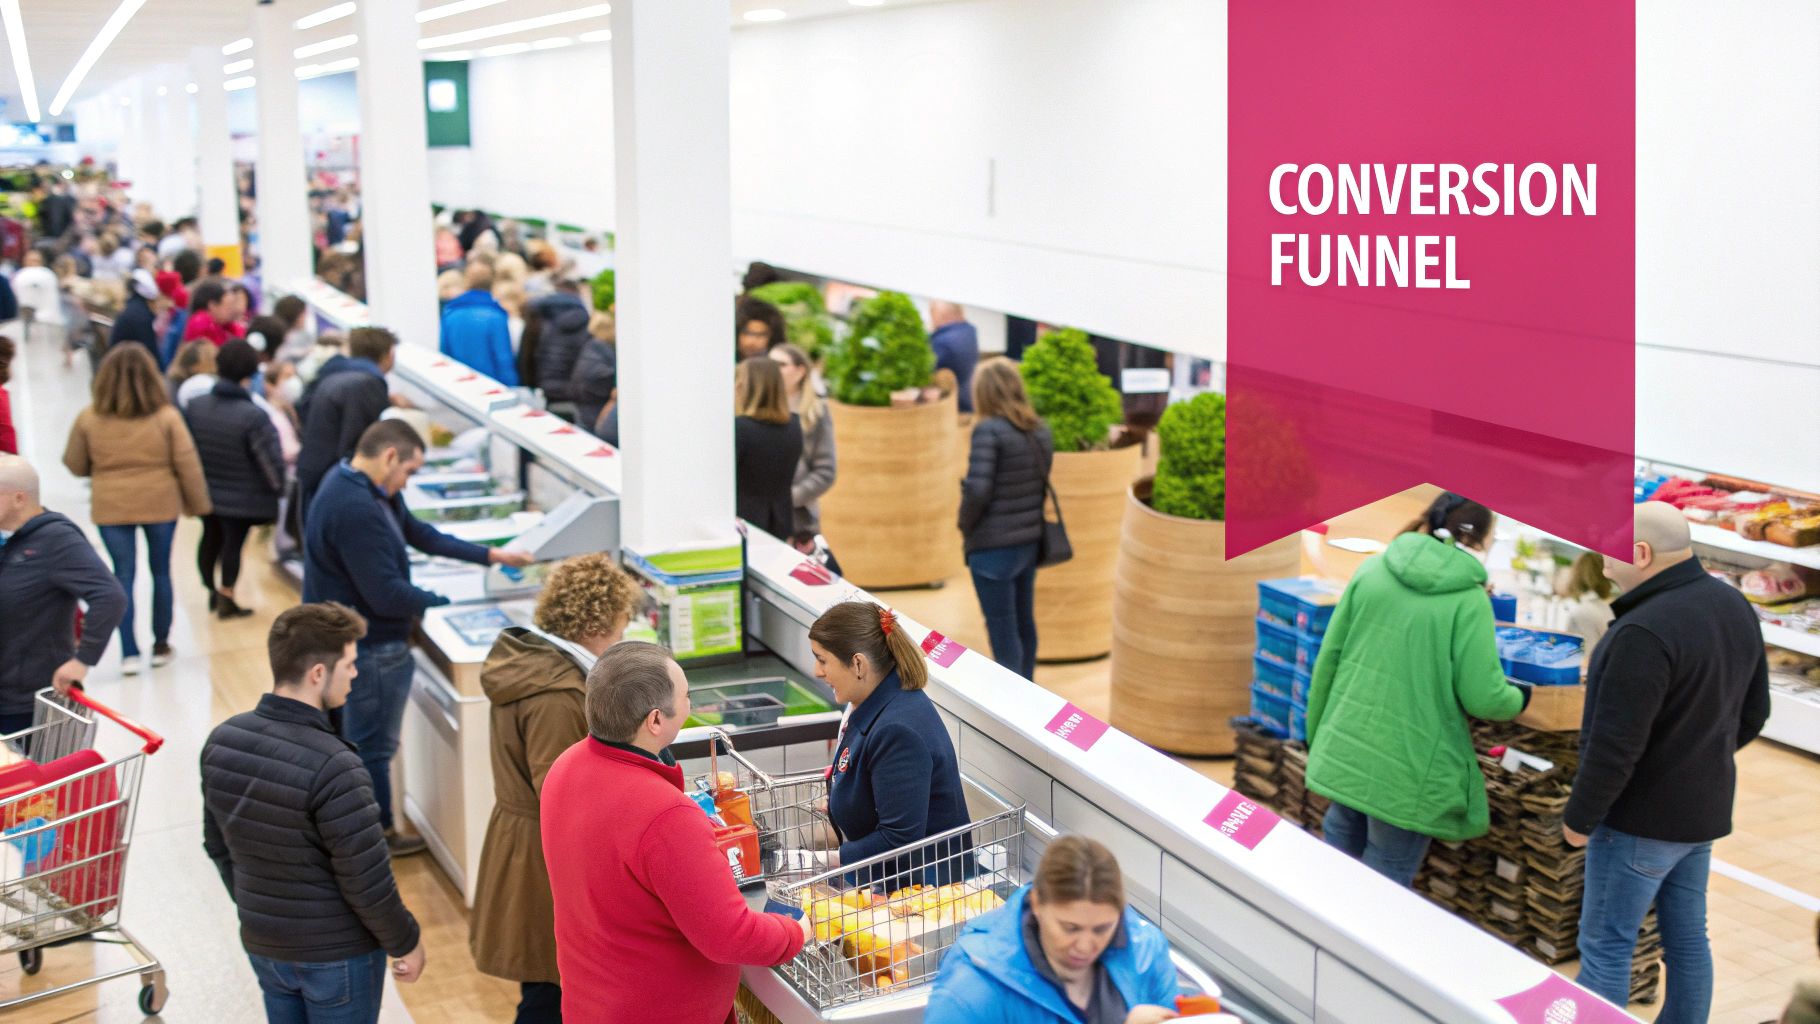
You might liken it to walking through a bustling store. At the front door, dozens stream in. A handful pause at displays. Fewer head to the till. And an even smaller group emerges as repeat customers or brand advocates.
Quick Conversion Funnel Overview
A conversion funnel channels prospects through five key stages:
- Awareness: Capturing attention through ads, social posts, or search
- Consideration: Prospects weigh their options and compare offers
- Conversion: That decisive moment when someone makes a purchase or signs up
- Retention: Encouraging customers to return and engage again
- Advocacy: Turning satisfied buyers into word-of-mouth promoters
That image neatly shows how each stage typically shrinks your audience by about 60–80 percent as you move closer to the checkout line.
Conversion Funnel Stage Summary
Below, you’ll find a snapshot of each stage along with the average drop-off rate you might see in an e-commerce scenario.
| Stage | Brief Description | Typical Drop Off |
|---|---|---|
| Awareness | First exposure via ads or content | 60% |
| Consideration | Shoppers compare products and features | 70% |
| Conversion | Final purchase or signup | 80% |
| Retention | Repeat visits and ongoing engagement | 50% |
| Advocacy | Customers recommending your brand | 30% |
That quick table highlights the rough percentages you can expect to lose at each checkpoint. Knowing these numbers helps you focus your efforts where the biggest leaks occur.
Curious about mapping every customer interaction along this journey? Dive deeper in our detailed CartBoss article on customer journeys.
Understanding Key Conversion Funnel Concepts
Imagine pouring water through a funnel—some drips right through, while most splashes out along the sides. Marketing funnels work the same way, guiding potential customers from a wide pool of strangers to a smaller group of buyers.
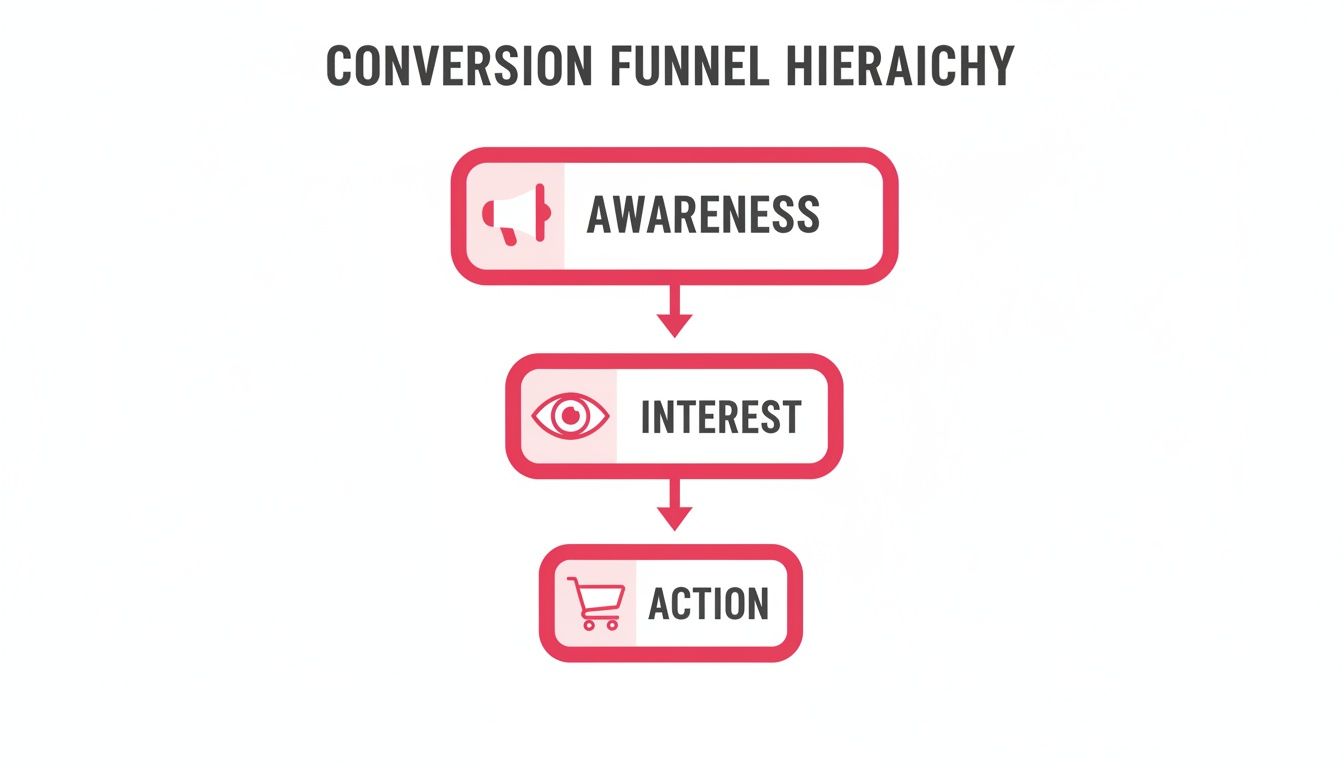
Back in 1898, Elias St. Elmo Lewis sketched out what we now call the AIDA model: Awareness, Interest, Decision, Action. He noticed that as people move from hearing about a product to actually buying it, there are natural drop-offs at each step. That simple four-stage map still underpins our modern approach.
Core Funnel Terminology
- TOFU (Top Of Funnel): Tracks those first, broad introductions—social posts, display ads, content reads.
- MOFU (Middle Of Funnel): Measures deeper engagement—newsletter sign-ups, webinar attendance, comparison guides.
- BOFU (Bottom Of Funnel): Follows prospects with clear intent—cart adds, checkout starts, demo requests.
Over the decades, we’ve shifted from tallying sole “last clicks” to mapping every micro-interaction. That change opened our eyes to complex journeys and hidden value.
Fast-forward to the digital era: Google’s 2011 launch of Multi-Channel Funnels showed that 35% of revenue came from non-last-click paths (2012 Analytics Report). And in 2023, Amplitude’s benchmarks across billions of user events revealed an average funnel completion rate of 5.2% for mobile apps—where TOFU→MOFU drop-offs sit at 62%, MOFU→BOFU at 78%, and BOFU→Action at 85%. Learn more about conversion funnel benchmarks on Amplitude
Below is a classic snapshot of the AIDA journey.
Each narrowing band reminds us that only the most motivated prospects make it all the way through.
Before we dive into optimization tactics, take a look at our guide on conversion tracking to see how micro-conversions feed each funnel stage.
Key Takeaway
Conversion funnels have evolved from simple ad counts to holistic journey mapping. Today’s analytics credit every meaningful touchpoint, not just the last click.
Evolution Of Funnel Frameworks
In the early days, funnels were treated like one-way pipes: prospects dropped in at the top and, if everything worked, they spilled out the bottom as customers. Those models missed all the back-and-forth that really happens.
Now, we embrace:
- Micro-conversions—small wins like video plays, gated-content downloads, or product page scrolls.
- Fractional attribution—splitting credit across every meaningful interaction.
- Weighted pipelines—focusing efforts where drop-off costs bite the hardest.
Getting comfortable with these ideas means you can map and measure every twist and turn in your buyer’s journey.
Why Funnel Mapping Matters
Think of funnel mapping as a health check for your marketing engine. By lining up expected vs. actual drop-off rates, you spot leaks early. That insight helps you pour resources—ads, content, or recovery messages—into the spots that deliver the biggest impact.
In the next chapters, we’ll unpack the KPIs to watch at each stage, offer real e-commerce examples of common leaks, and arm you with practical tactics to plug every hole.
Exploring Conversion Funnel Stages
Imagine walking down a crowded street lined with shops, each window display drawing its own crowd. Just like that, a conversion funnel guides visitors through stages that require different messages and metrics.
By treating each phase as a storefront moment, you can see exactly what content and tactics will hook someone—or lose them. Before we dive in, here are the five checkpoints every prospect moves through:
- Awareness First glance at your storefront
- Consideration Shoppers examine products
- Conversion Customers check out
- Retention Repeat buyers return
- Advocacy Fans spread the word
Awareness Stage
In the Awareness Stage, people spot your brand from afar. Picture bold window art that stops passersby in their tracks. Since 75% of visitors click away before engaging, it’s critical to serve up eye-catching ads and shareable social posts.
Try these tactics to grab attention:
- Blog posts that solve common problems
- Social media stories with on-point hashtags
- Display ads aligned with search queries
“Awareness builds the foundation for all further interactions,” says a leading marketer.
This stage is about sparking curiosity and laying the groundwork for deeper engagement.
Consideration Stage
Once your audience steps inside, the Consideration Stage kicks off. They’re comparing options under the showroom lights, reading reviews, and weighing features.
Key activities include:
- Downloading detailed guides
- Watching demo videos
- Joining live webinars
Watch for these drop-offs:
- Vague value propositions
- Information overload
- Slow-loading pages
| Content Type | Visitor Action | Goal |
|---|---|---|
| Case Study | Read and relate | Build confidence |
| Product Demo | Watch and evaluate | Show features |
| Customer Review | Trust and socialize | Reduce doubt |
Conversion Stage
Conversion feels like lining up at the checkout counter. At this point, prospects are ready to buy. Simple tweaks here can boost revenue by 20–35%.
To streamline checkout:
- Simplify forms with pre-filled fields
- Offer guest checkout and multiple payment options
- Make shipping and returns crystal clear
CartBoss merchants report a 50% lift in recovered sales by automating SMS reminders. Dynamic discount codes via text can seal the deal without extra manual work.
Retention Stage
Once the sale goes through, Retention is all about keeping that momentum. Think of loyalty cards and follow-up messages that feel personal.
Effective tactics:
- Send thank-you notes via email or SMS
- Offer exclusive next-purchase discounts
- Gather feedback to tailor future offers
- Segment buyers for targeted campaigns
SMS alone boasts a 99% open rate and drives 15–20% repeat purchases.
Returning buyers spend 67% more on average than new ones.
Advocacy Stage
Advocacy transforms happy customers into your biggest fans. It’s like word-of-mouth marketing on steroids.
Here’s how to cultivate advocates:
- Launch referral programs with mutual rewards
- Showcase customer stories in your content
- Reward social shares with loyalty points
Don’t forget to measure enthusiasm with a Net Promoter Score survey.
Below is a quick checklist to keep your funnel tight:
- Map each stage’s KPIs and set targets
- Implement CartBoss SMS flows for cart recovery
- Monitor conversion rates and refine weekly
- Survey customers for fresh insights
By optimizing every stage—from that first window glance to cheers from loyal advocates—you’ll plug leaks and maximize impact across the board.
Ready to plug funnel leaks and boost ROI with CartBoss?
Tracking Funnel Metrics And KPIs

Think of your funnel as an upside-down pyramid. At the very top, you pour in hundreds or thousands of visitors—but only a fraction trickles down to purchase. By measuring specific numbers at each stage, you can spot where the biggest drips happen and plug those leaks before they cost you serious revenue.
Top-of-funnel metrics like impressions and click-through rates tell you how wide your net is. In the middle, email signups and content downloads reveal who’s warming up. Down at the bottom, cart-to-purchase rates and completed checkouts show real, hard returns. Finally, post-purchase figures—like repeat purchase rate and Net Promoter Score—tell you if customers stick around and spread the word.
For instance, most e-commerce sites see 95–98% of top-funnel visitors drop off before buying, leaving a global average conversion rate of just 2–3%. Yet, tighten one stage—say, smoothing out checkout friction—and you could lift overall conversions by 20–35%. One SaaS client climbed from 1.2% to 4.1% by focusing on a single button tweak. Discover more insights in Statsig’s research: Learn more about conversion funnel analysis
Key Funnel Metrics And Benchmarks
Below is a quick reference for core funnel metrics and their typical industry ranges. Use this table to compare your performance at a glance and flag stages that need attention.
| Stage | Metric | Typical Rate |
|---|---|---|
| Awareness | Impressions, CTR | 1–3% CTR |
| Consideration | Email Signups, Downloads | 10–25% |
| Conversion | Cart-to-Purchase | 2–4% |
| Retention | Repeat Purchase Rate | 20–30% |
| Advocacy | NPS, Referral Rate | 30–50 NPS, 5% Referral |
Use these benchmarks as your starting line. If you’re off by several points, you know exactly where to drill down.
Calculating Micro Conversion Rates
Micro-conversions only inch visitors forward—video plays, guide downloads or newsletter opt-ins. They’re small wins, but they predict bigger moves later on.
To calculate a micro-conversion rate:
- Count the micro-conversion events during your chosen timeframe
- Divide by the total number of visitors in that same period
- Multiply by 100 to get a percentage
For example, if 500 people download your ebook out of 5,000 page views, your micro-conversion rate is 10%.
Setting Realistic Targets
Real progress starts with benchmarks you already hit. Then, set modest goals for each funnel slice—small tweaks you can manage in a quarter without burning out your team. Adjust for seasonality and campaign lifts as you go.
- Stage Goals: Aim for incremental, quarter-over-quarter gains per funnel stage
- Funnel Goal: Tie your collective lift back to revenue projections
- Review Cycle: Check progress monthly and after any major push
Monitoring And Reporting
A tidy dashboard keeps you out of trouble. Pick a tool like Google Analytics 4, Mixpanel or CartBoss’s own reporting suite and display your critical KPIs on one screen.
- Chart impressions, CTRs, micro-conversions and checkout starts side by side
- Track repeat purchase rate and NPS on a separate widget each month
- Annotate when you launch campaigns or run tests so you can link spikes and dips
Designing Your Dashboard
A balanced dashboard marries big-picture metrics with the small signals that matter. We recommend:
- A “drop-off paths” graph to see exactly where prospects bail out
- A revenue vs. funnel lift chart to tie every tweak back to dollars
- An SMS recovery panel—showing CartBoss’s impact on abandoned-cart rescue
Prioritize Optimization Efforts
Chase the biggest leaks first. If your Consideration stage slides under 10%, rethink your content offers and calls-to-action. If your Conversion rate falls below 2%, simplify that checkout flow or ramp up recovery messages.
CartBoss merchants routinely recover up to 50% of lost sales with automated SMS reminders at checkout’s final hurdle. Check out our guide on Attribution Modeling for a deeper look at assigning credit across stages: Learn more about attribution modeling
Stay disciplined with regular A/B tests and clear, revisited targets. That way, you always know which stage deserves your next round of investment.
Ecommerce Funnel Examples And Drop Off Causes
Seasonal promotions often reveal exactly where shoppers bail before hitting “buy.” Unexpected fees or lengthy, clunky forms can spook even the most interested customer.
- Extra Fees when costs sneak in late drive 55% of buyers away.
- Complex Processes like long forms or slow-loading pages trigger 21% of cart abandons.
- Account Creation requirements push 18% of users to drop off mid-checkout.
Imagine running a holiday flash sale without clear shipping details—it almost guarantees a cart spike. Big retailers such as Target plugged leaks by adding transparent pricing bars during checkout. Smaller brands recover up to 50% of abandoned carts simply by sending SMS reminders within an hour.
On average, 69.8% of online carts are abandoned worldwide, according to the Baymard Institute’s 2023 report, costing U.S. retailers about $260 billion each year. Learn more about these findings
These drop-offs hit hardest during peak traffic—holidays, flash sales—whenever your UX wrinkles get magnified.
Ecommerce Success Illustrations
Small tweaks can yield big wins.
- Bed Bath & Beyond cut drop-offs by showing clear progress indicators and estimated times remaining.
- Agile micro-brands pair limited-time SMS codes with pre-filled checkout links to reclaim 50% of carts.
“Guest checkout options can cut abandonment by up to 40%,” notes an industry report.
Cutting out forced sign-ups and simplifying forms slashes friction. Transparent pricing bars eliminate nasty surprises, while progress breadcrumbs keep shoppers moving. Timed SMS nudges pull people back before they forget key details—CartBoss clients routinely win back nearly half of all abandoned carts.
Read also: Explore top shopping cart abandonment reasons in our article on abandonment causes.
Diagnose And Recover Lost Revenue
First, map out your funnel leaks with drop-off reports and session replays. A clear dashboard highlights the worst trouble spots; recordings reveal exactly where users hesitate.
- Offer guest checkout to remove signup barriers.
- Show shipping and tax breakdowns upfront.
- Automate SMS recovery flows with CartBoss to reclaim lost carts.
Prioritize A/B tests on your busiest pages—compare form lengths, button text, and layout tweaks. Set stage-by-stage targets and review them monthly. Then document successes and share insights so your team can keep iterating.
Next Steps And Measurement Guidance
A simple checklist keeps you on track:
- Audit current drop-off rates and identify your biggest leaks.
- Simplify checkout forms and test guest-access options.
- Add transparent fee displays and progress bars.
- Enable CartBoss SMS reminders within 30 minutes of abandonment.
- Run A/B experiments and track lift for each variation.
- Report results, refine targets, and repeat.
Link recovered carts back to sales data for clear ROI. Track KPIs like cart recovery rate, conversion uplift, and average order value. Share monthly summaries to maintain stakeholder buy-in. Then refine copy, timing, and design based on test results and user feedback.
With these examples, data points, and tactics, you’ll seal revenue leaks and capture more sales.
Key Takeaway Prepare your funnel for peak traffic, and use CartBoss to reclaim up to 50% of lost revenue.
Start diagnosing your ecommerce funnel today—you’ll see conversion rates climb right away. Use these data-driven insights to fuel growth in the next quarter and beyond.
Practical Funnel Optimization Tactics And Next Steps
Good data is your best ally. When you instrument every key action—from page views to “Add to Cart” clicks—you’ll see exactly where prospects stall.
Start by setting up event tracking in tools like Google Analytics 4, Mixpanel, or CartBoss’s built-in analytics. Capture page visits, button taps, form submits, and cart additions to map out your funnel.
Setup And Audience Segmentation
Break your traffic into meaningful cohorts. For instance, tag anyone who browsed a product page but never added an item to their cart.
Then route those segments into tailored SMS flows or retargeting campaigns to re-engage them personally.
- Group visitors by funnel stage and track each segment size with 10% accuracy.
- Use dynamic lists that refresh automatically as behaviors change.
- Audit and tweak segmentation rules at least once a month.
With your audience lined up, you can craft SMS journeys that nudge shoppers back into action.
SMS Cart Recovery Use Cases
Well-timed texts can rescue abandoned carts—up to 50% back when messages hit within the first 30 minutes.
CartBoss simplifies this with prewritten templates and auto-generated discount codes.
- One store deployed a three-message series and saw a 30% lift in recoveries.
- Another paired SMS reminders with countdown timers, boosting flash-sale recoveries by 40%.
- Sequence timings: 5, 15, and 60 minutes after abandonment.
- Launch free-shipping codes first, then ramp up offers.
Countdown Timers And Urgency Hooks
Adding timers to your product and checkout pages triggers action. When shoppers see seconds ticking down, they buy faster.
- Display remaining time on cart items.
- Choose high-contrast colors for visibility.
- Sync the countdown with live stock levels.
Email Drip Campaign Best Practices
Emails help you stay top of mind. Build a concise drip with three to five touches that raise value and weave in social proof.
- Open with a killer CTA and a clear subject line.
- Segment by engagement—different messages for cold, warm, and hot leads.
- Track opens and clicks to refine your approach.
- Use personalization tokens for names and products.
- A/B test subject lines weekly.
- Remove subscribers after three consecutive unopened emails.
Next Step Checklist
- Audit each funnel stage and log drop-off rates.
- Streamline checkout with shorter forms and guest access.
- Deploy CartBoss SMS flows to cover every funnel phase.
- Run A/B tests on emails, SMS sequences, ads, and timers.
- Review performance weekly and tweak accordingly.
Measurement anchors your progress. Keep an eye on these metrics:
| Metric | Target | Frequency |
|---|---|---|
| Cart Recovery Rate | 30% | Weekly |
| Conversion Uplift | 20% | Monthly |
| Average Order Value | Grow 10% | Monthly |
| SMS Open Rate | 99% | Ongoing |
Tip Align your reviews with peak traffic windows to catch new leaks under real-world pressure.
Advanced Event Tracking
Beyond pageviews, track micro-conversions like “Add to Wishlist” clicks. Fire custom events via Google Tag Manager or CartBoss’s dashboard:
These snippets feed your reports with granular data—prime for powering targeted flows and ads.
Ongoing Optimization Cycle
Optimization never stops. Every month, audit your funnel metrics, update segments, and plan new experiments.
Hold brief cross-team syncs to share insights and prioritize tests.
Pro Tip Keep a shared tracker—whether it’s a spreadsheet or project tool—to centralize findings and next steps.
With this playbook and CartBoss in your toolkit, you’ll systematically seal leaks and lift revenue. Launch parallel SMS flows, retargeting ads, timers, and email drips. Measure everything, iterate fast, and watch your e-commerce numbers climb.
Ready to boost your cart recovery? Start a free trial of CartBoss today and see real impact within days. No coding required and zero subscription fees make it painless to adopt. Sign up now and turn abandoned carts into profit on autopilot. Optimize your flows, test continuously, and master the art of funnel growth. Your conversion funnel will thank you.
Frequently Asked Questions
What Tools Reveal Funnels in Real Time?
If you want to see every step unfold as it happens, modern analytics platforms have you covered.
- Google Analytics 4 for instant reports and visual drop-off paths
- Mixpanel to dive into event-level streams
- CartBoss Dashboard for SMS-powered insights that tie directly to your funnel
“Real-time funnel insights help marketers react instantly to drop-offs.”
How Can I Track Multi-Channel Attribution?
Imagine you’re running ads, emails and SMS campaigns all at once. To figure out which channel deserves credit, you tag each link with UTM parameters and employ a multi-touch model. This approach splits credit across every touchpoint, so you can pinpoint which email, ad or text nudged a prospect forward.
Do Small Businesses Need a Full-Funnel Strategy?
A lot of small stores kick off with Awareness, Conversion and Retention—and that can work. But weaving in Consideration and Advocacy deepens customer loyalty and sparks word-of-mouth. In the long run, those extra stages pay big dividends.
How Often Should I Audit My Funnel Performance?
Timing is everything. If you wait too long, minor leaks become major losses. But checking in every week can burn out your team. A good rhythm looks like this:
- Monthly high-level checks to spot surprises
- Quarterly deep dives to plug hidden drop-offs
Funnel Basics
Picture your funnel as a series of gates that narrows every step of the way. It starts broad—reaching anyone who might be interested—and funnels down to repeat buyers and even brand advocates.
Key Metrics By Stage
| Stage | Key Metric |
|---|---|
| Awareness | Impressions & CTR |
| Consideration | Email Sign-Ups |
| Conversion | Cart-to-Purchase Rate |
| Retention | Repeat Purchase Rate |
| Advocacy | Net Promoter Score (NPS) |
How Can CartBoss Help With Optimization?
Here’s where CartBoss shines. By sending automated SMS reminders, it recovers up to 50% of abandoned carts—without you lifting a finger. Those texts plug right into your funnel, sealing revenue leaks on autopilot.
Where Can I Find Detailed Funnel Tips?
For step-by-step guides, ready-to-use templates and real-world examples, head over to the CartBoss blog. You’ll find actionable advice designed to boost every stage of your funnel.
Ready to turn abandoned carts into profit? Start your free trial with CartBoss at CartBoss