



Return on Ad Spend (ROAS) is a straightforward but incredibly powerful metric. It tells you exactly how much revenue your business earns for every single dollar you spend on advertising.
Think of it like this: if you put $1 into a Google Ad, and that ad brings in $4 in sales, your ROAS is 4:1. It’s the cleanest, most direct way to know if your ad campaigns are actually making you money or just burning through your budget.
Understanding Your Most Important E-Commerce Metric

At its heart, ROAS cuts through all the noise to answer one simple question: “Are my ads profitable?” While plenty of other metrics track clicks, impressions, or engagement, ROAS gets right to the point—the financial result of your marketing.
This focus on raw efficiency is why it’s so critical for e-commerce stores. Knowing your ROAS lets you make smarter, data-backed decisions about where to put your money. A campaign with a killer ROAS deserves more investment, while one that’s struggling needs to be tweaked or shut down before it drains your funds.
The Core Components of ROAS
To really get a grip on this metric, you need to understand its two key ingredients. Each one tells an important part of your advertising story.
- Revenue from Ads: This is the total income generated directly from a specific ad campaign. Accurate tracking here is non-negotiable; you have to be sure you’re only counting sales that came from that ad.
- Cost of Ads: This is the total amount you spent to run the campaign. It’s not just what you paid the ad platform—it should also include related costs like design work or agency fees.
Of course, ROAS is just one piece of the puzzle. For a complete health check on your store, you’ll want to explore the other vital e-commerce metrics you should be tracking.
By focusing on revenue generated per dollar spent, ROAS provides a direct line of sight into the financial effectiveness of your marketing, helping you separate the campaigns that fuel growth from those that drain your budget.
To make this even clearer, the table below breaks down these core concepts. It’s a quick-reference guide to give you a solid foundation before we jump into the formula and start improving this number for your business.
ROAS At a Glance
This table sums up the essential parts of Return on Ad Spend.
| Concept | Explanation | Example |
|---|---|---|
| ROAS | Measures gross revenue generated for every dollar spent on advertising. | You spend $100 on ads and make $500 in sales, resulting in a 5:1 ROAS. |
| Revenue | The total sales value attributed directly to your ad campaign. | Clicks from a Facebook ad campaign led to $2,000 in completed orders. |
| Ad Cost | The total expense to run the ad campaign. | The cost to run the Facebook ads was $400. |
With these basics covered, you’re ready to see how calculating and optimizing ROAS can become your secret weapon for profitable growth.
The Simple Math for Calculating Your ROAS
Calculating your Return on Ad Spend is refreshingly simple. The formula gives you a clear, direct measure of how well your campaigns are performing, cutting through the noise of vanity metrics to focus on pure financial return.
The core formula is just two parts:
ROAS = Total Revenue from Ad Campaign / Total Cost of Ad Campaign
Your result can be shown as a ratio, like 4:1, or as a percentage, like 400%. Both mean the same thing: for every $1 you put into your ads, you got $4 back. A ratio of 1:1 (or 100%) is your break-even point.
Putting the Formula into Practice
Let’s walk through a real-world e-commerce example. Imagine you run a Shopify store selling custom pet portraits. You decide to launch a targeted Facebook Ads campaign to promote a new product line.
- Total Revenue from Ads: After running the campaign for a month, you check your analytics and see it generated $10,000 in direct sales.
- Total Cost of Ads: You spent $2,000 on the Facebook ads.
Plugging those numbers into the formula is a breeze:
$10,000 (Revenue) / $2,000 (Cost) = 5
This gives you a ROAS of 5:1, or 500%. That means for every single dollar you invested in those Facebook ads, you brought in five dollars in revenue. It’s a strong signal that the campaign was a huge success. If you want a deeper dive into the nuts and bolts, this guide on how to calculate ROAS is a fantastic resource.
Accounting for All Your Costs
Here’s where a lot of people trip up. They only count the direct ad platform spend. To get a true picture of your ROAS, you have to include all the associated costs. Your total cost is almost always more than just what you paid Google or Meta.
A truly accurate ROAS calculation moves beyond platform spend. It must account for every dollar invested in the campaign, from creative development to agency fees, to reveal the campaign’s genuine financial impact.
Let’s consider a more complex Google Ads campaign for that same pet portrait store:
- Platform Ad Spend: $4,000
- Agency Management Fee: $1,000
- Video Ad Creative Production: $500
- Graphic Design for Display Ads: $250
In this scenario, your Total Ad Cost isn’t $4,000—it’s $5,750. If this campaign pulled in $23,000 in revenue, your true ROAS looks like this:
$23,000 / $5,750 = 4
That’s a 4:1 ROAS. If you hadn’t included that extra $1,750 in costs, you’d have mistakenly calculated a 5.75:1 ROAS, giving you a dangerously inflated sense of profitability. To make sure you don’t miss anything, a good Return on Ad Spend calculator can help you keep all the variables straight.
What Is a Good ROAS in E-Commerce?
So you’ve got your ROAS number. The big question now is, is it any good? The honest answer is… it completely depends on your business. There’s no magic number that works for everyone.
You’ll often hear a 4:1 ROAS thrown around as the gold standard, meaning you make $4 for every $1 you spend on ads. And while that’s a solid target for many stores, it’s far from a universal rule. If you’re selling high-margin luxury watches, a 4:1 return could mean you’re rolling in profit. But for a business selling low-margin t-shirts, a 4:1 ROAS might actually be losing you money.
The only number that truly matters, to begin with, is your break-even point. If your profit margin is 25%, you need a 4:1 ROAS just to cover your product and ad costs. Anything less, and you’re paying for the privilege of giving your products away.
Setting Realistic Benchmarks
To figure out what a “good” ROAS looks like for your store, you have to ignore the generic advice and dig into your own numbers. Your target needs to be ambitious enough to drive growth but grounded in the reality of your margins and industry.
Start by calculating your break-even ROAS. Once you have that, you can set smarter, tiered goals:
- Acceptable ROAS: This is your baseline—the minimum return you need to make a small but sustainable profit.
- Target ROAS: This is the goal for most of your campaigns. It should deliver healthy, predictable profits that you can build on.
- Exceptional ROAS: Think of this as your home-run number. When a campaign hits this, it’s a clear signal to scale up your ad spend and ride the wave.
Understanding your own benchmarks is the key to spending money effectively. For a deeper dive, check out our complete guide to allocating your digital marketing budget to make sure every dollar is pulling its weight.
The Competitive Digital Advertising Environment
Let’s face it: the digital ad space is more crowded and expensive than ever. This makes hitting a high ROAS both more difficult and more critical for survival. The pressure to spend efficiently is intense.
In 2024, marketers worldwide are on track to spend nearly $1.1 trillion on ads. Digital channels are eating up over 72% of that pie, totaling more than $790 billion. This insane level of spending means you’re fighting harder than ever for every eyeball and click. To learn more about this trend, you can check out these global ad spend forecasts and trends.
In a world where ad costs are always climbing, a good ROAS isn’t just about making sales—it’s about staying profitable enough to keep the lights on. The game has shifted from just acquiring customers to acquiring them profitably.
This reality means you can’t afford to waste a single dollar. Every campaign needs to be fine-tuned, and every channel has to prove its worth with a solid, measurable return. That’s why strategies that boost the “revenue” side of the ROAS equation without increasing ad spend—like using SMS for cart recovery—are no longer just nice-to-haves. They’re essential levers for growth.
Comparing ROAS vs ROI vs CAC
The world of marketing metrics is a sea of acronyms, and it’s easy to get overwhelmed. While ROAS is your go-to for measuring ad campaign efficiency, it doesn’t paint the whole picture on its own.
To really get a grip on your business’s health, you need to see how Return on Ad Spend fits alongside two other heavyweights: Return on Investment (ROI) and Customer Acquisition Cost (CAC).
Think of it like this: ROAS is a tight, close-up shot of how a specific ad campaign is performing. ROI is the wide-angle, panoramic view of your entire business’s profitability. And CAC? That’s a focused portrait of exactly what it costs you to win a single new customer. Each one gives you a unique and essential perspective.
Distinguishing Key Performance Indicators
Even though they all touch on profitability, their scope and purpose are completely different.
ROAS is tactical. It helps you tweak and optimize individual ad campaigns for better performance. ROI is strategic, guiding your bigger business investments. And CAC is all about measuring the cost-efficiency of your growth engine.
To see what this looks like in practice, the map below breaks down the possible outcomes your ROAS can deliver—from losing money to breaking even and, finally, to healthy, profitable growth.
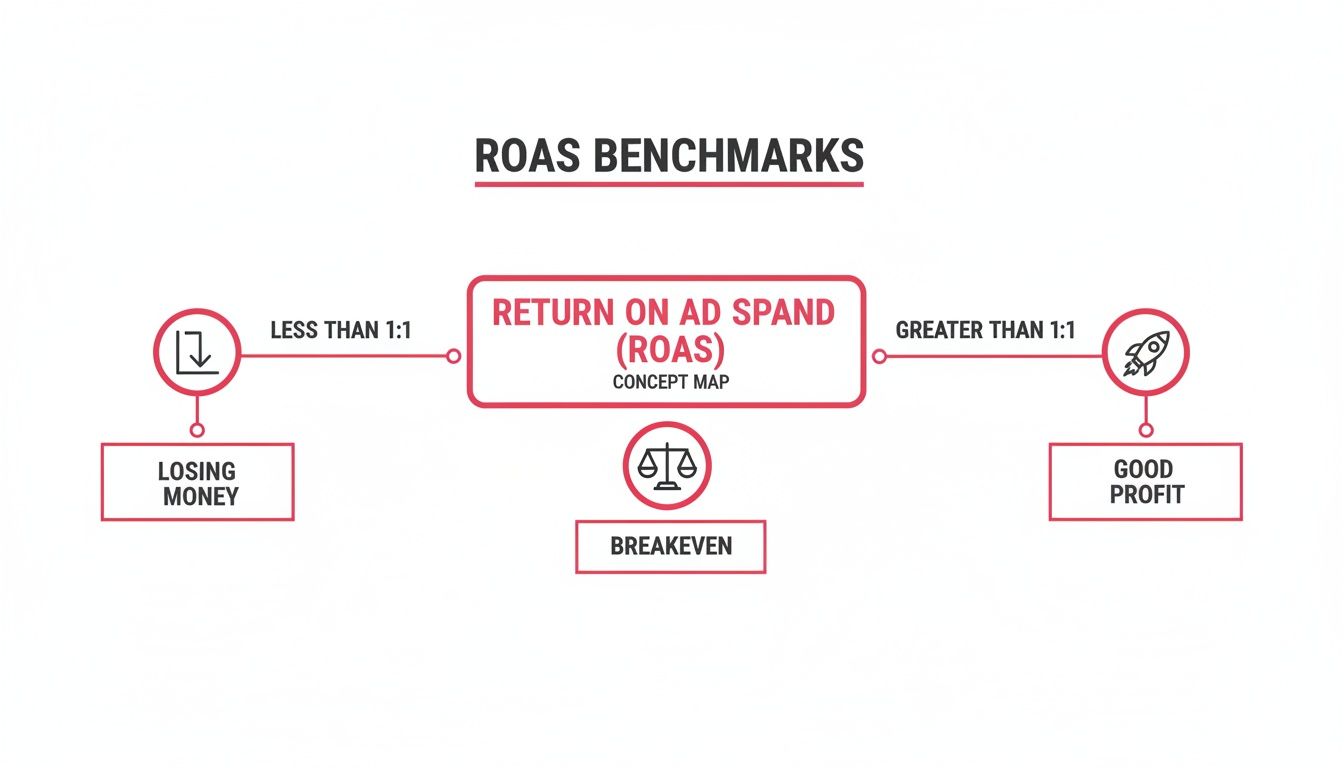
As you can see, a ROAS that dips below your break-even point is a clear loss, while a strong return is what fuels your business and allows it to scale.
ROAS vs ROI vs CAC Compared
Let’s break these three critical metrics down side-by-side. The following table clarifies what each one measures, how it’s calculated, and when you should use it. Getting this framework right is key to making smarter decisions.
| Metric | What It Measures | Formula | Primary Use Case |
|---|---|---|---|
| ROAS | Gross revenue generated from a specific ad campaign. | Revenue / Ad Cost | Evaluating the direct effectiveness of your ad campaigns. |
| ROI | Overall net profit generated from a total investment. | (Net Profit / Total Investment Cost) x 100 | Assessing the profitability of a broad business initiative. |
| CAC | The average cost to acquire a single new customer. | Total Marketing & Sales Costs / New Customers Acquired | Measuring the efficiency of your customer acquisition efforts. |
It’s crucial to understand how these metrics interact. A high ROAS looks great on the surface, but it’s meaningless if your CAC is so high that you’re losing money on every sale. Likewise, profitable ad campaigns won’t save a business with a negative overall ROI.
These metrics have to work together. They provide the checks and balances you need for a complete and honest view of your financial performance.
Ultimately, mastering ROAS gives you control over your campaign-level success. But pairing it with a sharp eye on CAC and ROI is what empowers you to build a truly sustainable and profitable e-commerce brand. To dive deeper into this, you can learn more about how to calculate your customer acquisition cost and see how it fits into your broader strategy.
Actionable Strategies to Dramatically Improve ROAS

Knowing your Return on Ad Spend is one thing. Actually improving it is where the real growth happens. High-impact strategies aren’t just about throwing more money at ads; they’re about spending smarter and squeezing every drop of value from the visitors you’ve already paid to attract.
The first move is to get your ad targeting laser-focused. Instead of casting a wide, expensive net, dive into your existing customer data. Use it to build detailed lookalike audiences on platforms like Facebook and Google. These audiences are algorithmically built to mirror your best customers, which means your ads are far more likely to land with people who actually want to buy.
Next up, your ad creative needs to pop. Generic ads are invisible. Use high-quality images and videos that show your products in the wild, solving real problems. Write copy that speaks directly to your audience’s wants and worries. A/B test everything—headlines, images, calls-to-action—to find the combination that pulls the best ROAS.
Maximize Your Existing Traffic
Fixing the top of your funnel is important, but the biggest lever you can pull to boost ROAS is often right under your nose: converting the visitors you already have. This is all about cranking up the “Revenue” side of the formula without touching the “Cost” side.
The single biggest revenue leak for any e-commerce store is cart abandonment. Think about it—a visitor who adds a product to their cart is screaming purchase intent. Letting them just walk away is like leaving cash on the table.
This is where automated recovery tools are an absolute game-changer. By systematically reaching out to these shoppers, you can turn would-be lost sales into pure profit, directly inflating your ROAS.
The most efficient way to improve your return on ad spend is to increase revenue from the traffic you already have. Recovering a single abandoned cart costs far less than acquiring a brand-new customer and has a direct, positive impact on your bottom line.
Supercharge ROAS with SMS Cart Recovery
While email recovery is a classic move, its power is fading thanks to crowded inboxes and low open rates. SMS, on the other hand, cuts right through the noise. It’s direct, immediate, and impossible to ignore.
This is the whole strategy behind tools like CartBoss, which uses automated text messages to bring shoppers back to finish their checkout. It’s wildly effective for a few simple reasons:
- Exceptional Engagement: SMS open rates hover around 99%. Your message is virtually guaranteed to be seen, usually within just a few minutes.
- Frictionless Experience: CartBoss sends a link that takes the customer straight back to their pre-filled checkout. No friction, no fuss. Just a simple path to purchase.
- Proven Results: The platform consistently delivers an average ROAS of 4,500% by targeting these high-intent moments. It turns a sunk acquisition cost into a massive revenue stream.
As digital ad spend is forecasted to dominate 75.2% of the global total by 2025, reaching a staggering $777 billion, you can’t afford to rely on inefficient channels. Adding a powerful SMS recovery strategy gives you a new, highly profitable revenue channel that pretty much runs on autopilot.
This approach directly boosts your total revenue, which in turn supercharges your overall return on ad spend. To dig deeper into the importance of smart ad investments, check out this piece on Why Optimize Ad Spend. It’s a strategy that also helps you reduce your overall customer acquisition costs, building a far more resilient and profitable business.
Common Questions About Return on Ad Spend
As you start using Return on Ad Spend to steer your marketing, some practical questions will inevitably pop up. We’ve gathered the most common ones here to give you clear, straightforward answers. Think of this as your quick-reference guide to build a rock-solid understanding of how ROAS actually drives business results.
Getting the hang of tracking, calculation, and strategy is what separates the good marketers from the great ones. Let’s tackle these common hurdles head-on.
How Do I Track ROAS Across Different Marketing Channels?
Tracking ROAS across all your channels boils down to one thing: consistent attribution. You absolutely need a reliable system to tell you exactly where your sales are coming from. The most common and effective way to do this is with UTM parameters. These are just simple tags you add to your ad links that label traffic from specific places, like a Google campaign or a Facebook ad.
Your analytics platform, whether it’s Google Analytics or a built-in dashboard like Shopify Analytics, reads these tags. This lets you slice and dice the revenue generated by each tagged campaign, giving you a clear ROAS for every single channel.
While platforms like Facebook Ads and Google Ads have their own ROAS reporting, it’s critical to compare that data with your own analytics. Ad platforms often use different attribution models (like last-click vs. multi-touch), which can sometimes inflate their numbers. A central analytics setup is your single source of truth. For channels like SMS recovery with CartBoss, the dashboard gives you precise data on revenue generated directly from sent texts, making its ROAS calculation exceptionally clean and accurate.
What Are the Most Common Mistakes When Calculating ROAS?
The single biggest mistake businesses make is under-reporting costs. So many people only count the direct ad spend—what they paid to Google or Meta—and completely forget about all the other expenses that went into making the campaign happen.
To get a true ROAS, you have to account for everything:
- Agency management fees
- Content creation costs (for video, images, or ad copy)
- Subscriptions for design or optimization software
- The cost of your marketing team’s time
Another classic error is messy revenue tracking. If you don’t set up your conversion tracking pixels or UTM tags correctly, you’ll get inaccurate revenue numbers, making your ROAS calculation totally unreliable. Finally, just trusting one platform’s reported ROAS without checking it against your own analytics can be dangerously misleading because of those different attribution windows and models.
Can I Have a High ROAS but Still Lose Money?
Absolutely. This is probably the most critical lesson to learn about Return on Ad Spend. A high ROAS can give you a false sense of security if you don’t know your numbers inside and out.
ROAS measures gross revenue, not profit. It tells you how much money came in the door, but it doesn’t say a thing about your business’s profit margins. This is the key distinction that can make or break your entire advertising strategy.
A high ROAS is just a vanity metric until it clears your break-even point. Success isn’t measured by revenue returned, but by actual profit in your pocket. Understanding your profit margin is non-negotiable.
Let’s say your business has a 25% profit margin. That means for every dollar in revenue, 75 cents goes toward the cost of the product, overhead, and other expenses. In this case, you need a ROAS of at least 4:1 (400%) just to break even on your ad spend. A 3:1 ROAS might look great on a report, but you’re actually losing money on every single sale. This is why knowing your break-even ROAS is essential—it’s the baseline that tells you if your campaigns are fueling growth or just slowly draining your bank account.
Ready to turn abandoned carts into your highest-ROAS channel? CartBoss uses automated SMS to recover lost sales and boost your revenue without any extra ad spend. Start recovering sales on autopilot today!