



Your store did €18,400 last month. Somewhere inside that number is a cart that sat untouched for two days, a text message that arrived at 7pm, and a shopper who clicked, came back and paid. It’s also possible that shopper would have come back anyway, with or without the message. That uncertainty sits underneath every recovery report you’ll ever read.
Most store owners don’t have a data problem. They have a decision problem. Sessions, conversion rate, average order value, abandoned checkouts, revenue attributed to this flow or that campaign, the dashboards are full of all of it. What’s missing is a defensible answer to one question: what do I change next week, and how will I know whether the change worked?
The difference between a useful stack and an expensive one comes down to whether its numbers survive a skeptical question about cause. Averages, last-click credit and unbounded attribution all fail that question. Events, segments and holdout groups pass it.
Table of Contents
- What Ecommerce Analytics Software Does
- How to Choose Ecommerce Analytics Software
- The Metrics Worth Tracking and What They Tell You
- Consent and Privacy Checks Before You Track
- Deciding Which Channel Gets the Credit
- How to Find Where Your Carts Leak Revenue
- Measuring SMS Recovery Without Overcounting
- Set a Baseline and Start Tracking This Week
What Ecommerce Analytics Software Does
Think of ecommerce analytics software as two systems running side by side. One is a till. It records every order, what was in it, what it was worth and which channel produced it. The other is a security-camera log: the product view, the search that returned nothing, the add to cart, the two visits that ended in nothing at all.
The warehouse desk below is the physical version of that pairing, with order software, a label printer and stock shelves all within arm’s reach of each other.
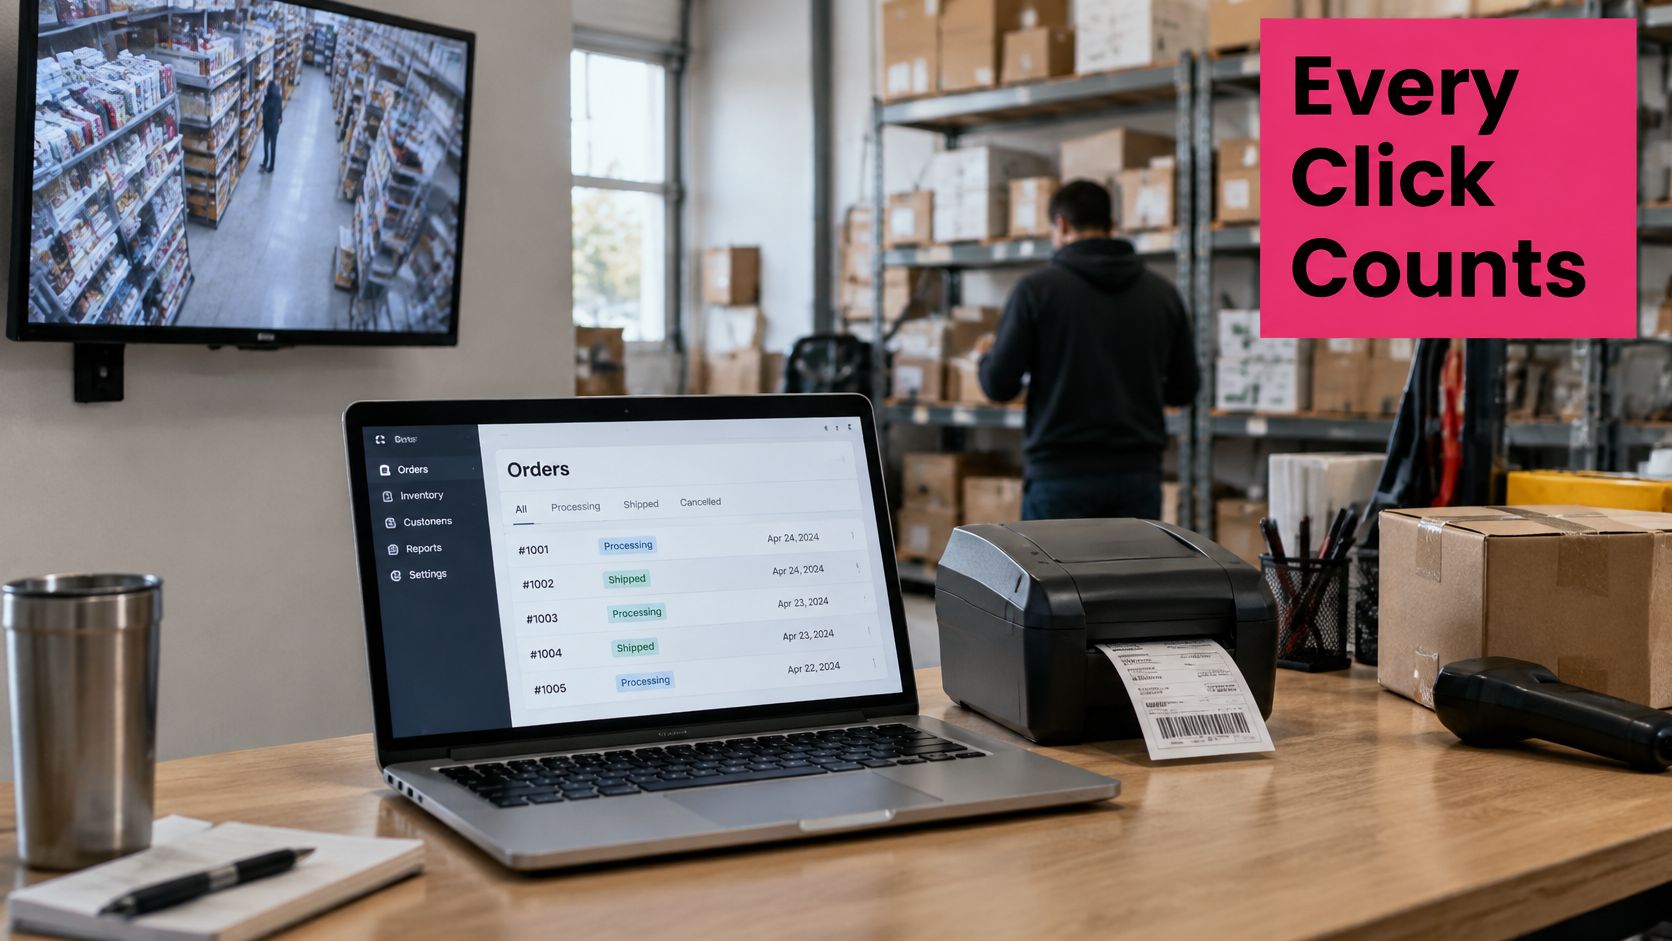
The camera log is where the money hides. A store that only counts orders sees €40,000 in revenue one month and €31,000 the next, with no explanation. A store that also counts sessions, product views, checkout starts and abandonments by device, country and channel can usually point at the step that changed.
That’s the core job: joining transactional, behavioral, marketing and customer data in one place so conversion, revenue, customer acquisition, retention and merchandising get measured together instead of argued about separately. The category is now big enough that most owners will subscribe to software rather than commission a build. One market assessment valued it at about $8.4 billion in 2025 and projects $22.6 billion by 2034, an 11.6% CAGR, with software products rather than implementation and consulting work taking 68.5% of 2025 revenue (roughly $5.75 billion) and cloud deployment at 65.4% against 34.6% on premises (Dataintelo ecommerce analytics software market report).
Most stores meet analytics in one of three forms:
- Storefront reports: Shopify or WooCommerce hands you orders, revenue and top products with zero setup, and stops at the edge of its own platform.
- A web analytics tool wired to the store: session and event data, funnel exploration, traffic sources, cheap or free, and usually blind to what happened after a shopper clicked into your SMS provider.
- A dedicated platform: event-level funnels, cohorts, message logs and revenue attribution in one account, with a subscription attached.
For a small store, the question isn’t whether analytics exists. It’s whether the tool in front of you shows numbers you’d act on, at a level of detail that lets you act.
How to Choose Ecommerce Analytics Software
Most buying decisions go wrong in the trial, not on the pricing page. Before comparing plans, decide what a tool has to prove, then run every candidate against the same week of your own orders and see which questions it answers without an export.
- Native fit. Does it connect to your storefront without custom code? Shopify and WooCommerce pass different data, and a marketplace seller gets less again.
- Event depth. It needs product views, searches, add to cart, checkout start and purchase. A tool that only counts sessions and revenue can tell you something moved, never where.
- Persistent identifiers. User, session, cart, campaign and order IDs have to survive the join across tools. If they don’t, every comparison between two systems becomes an argument.
- Segmentation on every metric. Device, country, product category and cart value. A number you can only view in total is hiding more than it shows.
- A messaging link. SMS and email logs tied to orders, plus a way to build a randomized group that receives nothing.
- Consent handling. The moment someone withdraws consent, tracking and messaging both stop, in the same place, without a manual step.
- Raw export. Order and event data you can download and open in a spreadsheet. Dashboards get replaced; your order history shouldn’t be held hostage by one.
- Total cost. Subscription plus per-message fees. For most small stores the messaging bill ends up larger than the software bill, and it’s the one nobody scopes.
The cheap start deserves a fair hearing. Platform reporting is free, accurate about its own transactions and useful for daily trading decisions, which is why so many small retailers lean on it as their main source. Its limit is scope, not quality: it measures what happened inside its own walls, and it rarely tells you what would have happened without your intervention.
Test before you sign: load one week of real orders into the trial and try to rebuild last month’s recovered revenue from scratch. If that needs a support ticket, the tool is the wrong shape for your team.
A tool that can’t answer “did the message cause this order” is a reporting tool. Buy it knowing which of the two you’re getting.
The Metrics Worth Tracking and What They Tell You
Start with seven numbers and the question each one answers. Anything that doesn’t map to a decision you’d make is decoration.
| Metric | Question It Answers | Where the Data Comes From |
|---|---|---|
| Cart abandonment rate | How many carts never become orders | Cart and checkout events |
| Checkout step drop-off | Which step makes shoppers leave | Checkout funnel events |
| Conversion rate by source | Which channels bring buyers | Referrer and campaign tags |
| Average order value | How much each order is worth | Order records |
| Repeat purchase rate | How often customers return | Customer and order IDs |
| SMS flow conversion | Whether automated messages earn orders | Message logs linked to orders |
| Profit after discounts | Whether revenue is real margin | Order data plus discount and message costs |
Read the metrics as a set, not a list
A high abandonment rate on its own tells you nothing. Pair it with checkout step drop-off and it turns into an address: carts die at the shipping form, or at the payment step, or at the sign-in prompt. Pair conversion rate with traffic source and you learn that one channel brings browsers while another brings buyers. Pair SMS flow conversion with profit after discounts and you find out whether the recovery campaign is buying revenue with margin.
Event-level data distinguishes itself from aggregate reporting. In a benchmark study of 200 ecommerce retailers and 600 shoppers, retailers that implemented personalization reported an average 45% conversion-rate increase, with average cart abandonment falling from 60% or more to 46%, while 60% of retailers achieved at least a 10% increase in average order value and 41% at least a 10% increase in revenue per user (Netcore Ecommerce Personalization Benchmark Report). Those gains came from acting on individual events (a product view, a search, an add to cart, a checkout start) rather than from reading a monthly total.
Why averages mislead
Every average you report is a blend of segments pulling in opposite directions. A 4% conversion rate can be 9% on desktop in one country and 1% on mobile in another, with the two cancelling out. A cart value average can look healthy while the only profitable recovery segment is orders above a certain basket size. Cut every metric by device, country, product category and cart value before you conclude anything.
The identifiers that make the joins work
Clean setups keep seven IDs: user, session, cart, campaign, timestamp, consent and order. Lose the cart ID and you can’t tie a reminder to the order it recovered. Lose consent status and you can’t tell an opted-out shopper from an unresponsive one. Lose the timestamp and you can’t check whether the message arrived before or after the return visit.
The ecommerce metrics to track guide covers the definitions for each of these in more detail. Pick the metric set, record it weekly, and write down each value before you change anything. A baseline you didn’t record is a number you’ll never be able to argue with.
Consent and Privacy Checks Before You Track
Consent decides which numbers exist, not just which messages you’re allowed to send. An opted-out shopper and an unresponsive one look identical in a recovery report, so the consent record is part of the measurement rather than a legal appendix. In Europe, electronic-privacy rules generally require prior consent for automated direct-marketing messages, SMS included, and GDPR consent has to be freely given, specific, informed and unambiguous, shown through a clear affirmative action (EU legal analysis of direct marketing consent). In the United States, text marketing sits under federal messaging and telemarketing rules, so the consent standard you must meet differs by market rather than by tool.
Work through this list before the first campaign goes out:
- Capture the number properly. A clearly worded marketing consent option that is not preselected, separate from any terms acceptance.
- Identify yourself. Sender name and purpose in the message itself, not only in a footer link.
- Record the proof. Consent timestamp, source page, exact wording and applicable country, stored where you can retrieve it later.
- Make opting out trivial. A STOP reply that works without a human reading it.
- Suppress immediately. An opt-out should remove the number from every queue within the same minute, including scheduled flows.
- Respect quiet hours. Some jurisdictions restrict sending times, so a default send window is safer than a manual check.
- Separate transactional from promotional. Order updates and cart-recovery nudges belong in different consent logic and different analytics.
- Map each destination country before you launch there. A consent record adequate in one market may not satisfy another.
Then put opt-out rate next to conversion rate on the same screen. A campaign that produces orders while complaints and unsubscribes climb is spending down list value, and the bill arrives later than the revenue. The record-keeping side, from wording to retention, is covered in our guide to data privacy in marketing.
Deciding Which Channel Gets the Credit
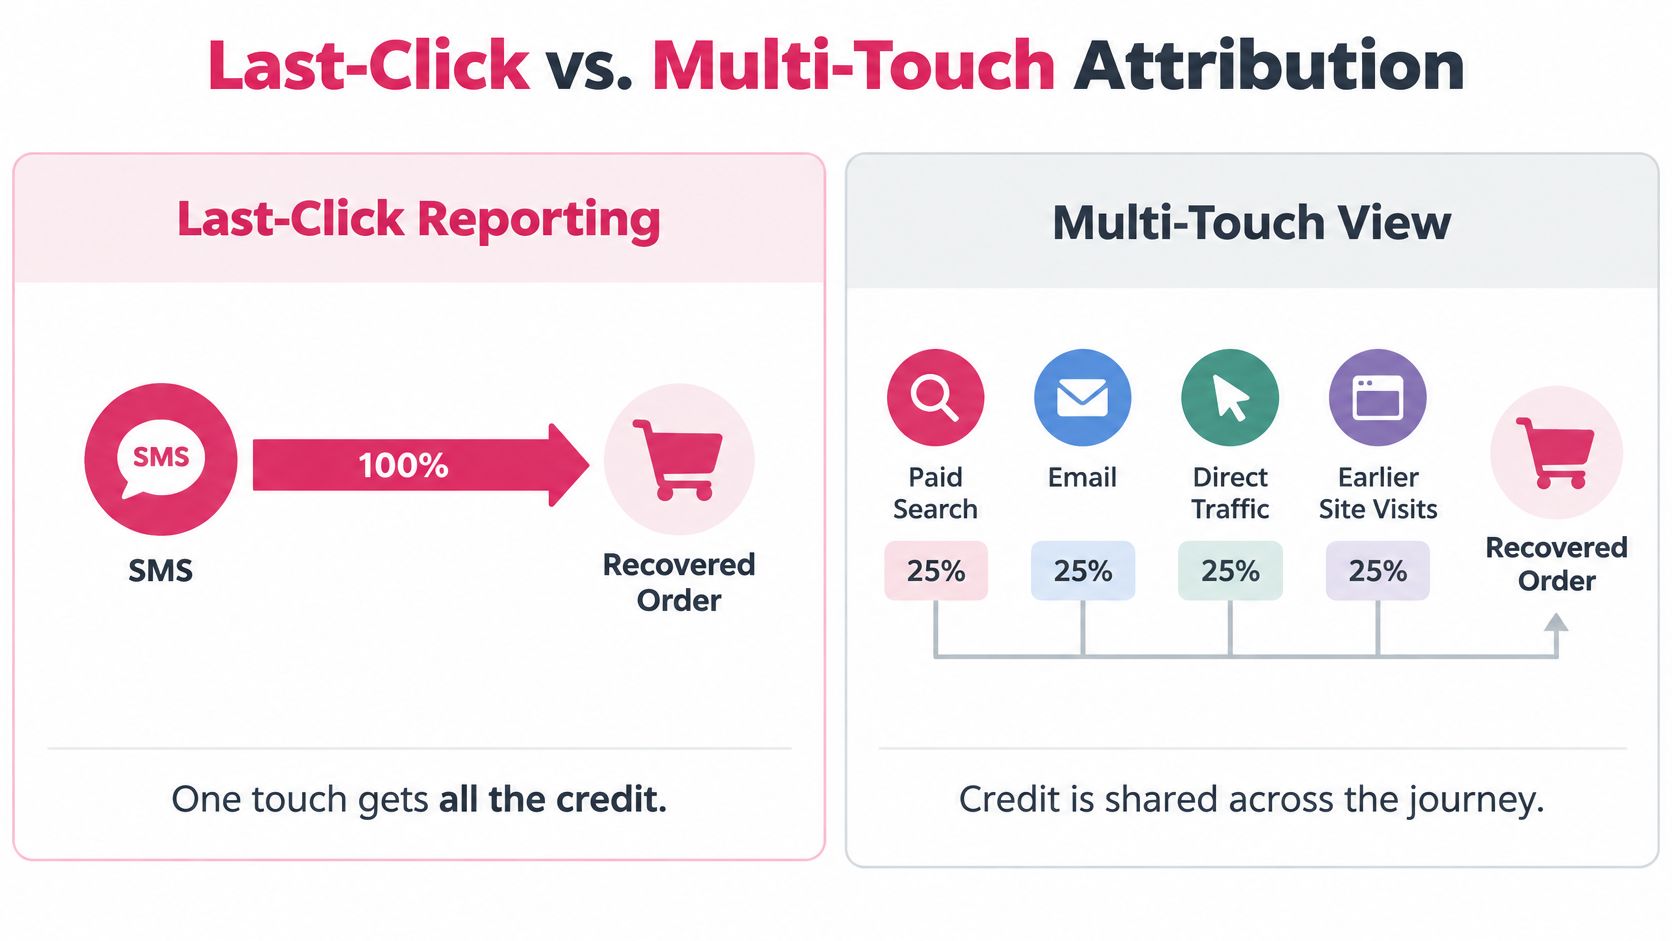
A last-click report will happily assign 100% of a recovered order to a single SMS message, even when paid search found the shopper, two earlier visits built the intent and a discount email tipped the decision. Attribution research comparing first-click, last-click and data-driven approaches treats budget allocation as a process that needs model comparison, data cleansing, enrichment and monitoring for gaps (SlashData attribution whitepaper). Change the model and channel revenue moves. That’s not a reporting quirk, it’s a different answer to the same question.
The diagram below shows the two worldviews side by side.
| Model | What It Credits | Main Risk |
|---|---|---|
| Last-click | 100% of the order to the final touchpoint | Over-credits recovery messages and retargeting |
| First-click | 100% of the order to the first touchpoint | Ignores what closed the sale |
| Data-driven | A share of credit estimated from touchpoint patterns | Needs clean, deduplicated event data |
| Incremental holdout test | Orders caused by a channel, against a control group | Requires a randomized holdout and patience |
The data work every model depends on
No attribution model survives messy inputs. Keep an append-only event stream, deduplicate repeated browser and server events so one purchase isn’t counted three times, reconcile order IDs across the storefront and the messaging system, and store consent and delivery status separately from clicks and purchases. Delivery is not engagement, and engagement is not revenue.
The holdout test as the fair measure
Split a randomized slice of your abandoned carts and send them nothing. Compare orders between the messaged group and the silent group over the same window. Then break the result down by country, device, customer status, time since abandonment, discount level and message frequency, because the average lift will be hiding a segment where the campaign loses money.
Clean test groups come from event-based audiences. We segment end users by three events, purchase completion, cart abandonment and newsletter subscription, which gives you populations you can compare without hand-built spreadsheet lists.
Here’s the mechanics of reading the result properly.
The measure worth reporting is incremental profit per message: orders that only happened because of the send, multiplied by margin, minus discount cost, divided by messages delivered. Attributed conversion volume will flatter you. That number won’t. Our guide to multi-touch attribution walks through the plumbing if you’re rebuilding credit rules from scratch.
How to Find Where Your Carts Leak Revenue
Cart abandonment is a measurable leak. Most carts never become orders, so the useful question is where each one stops. Baymard’s checkout research rates 65% of ecommerce checkouts as mediocre or worse, with only 2% rated good (Baymard checkout usability research). A funnel splits that loss into steps you can fix.
The funnel below is the shape of the problem: a short chain of steps, one of which gives most of the money back.
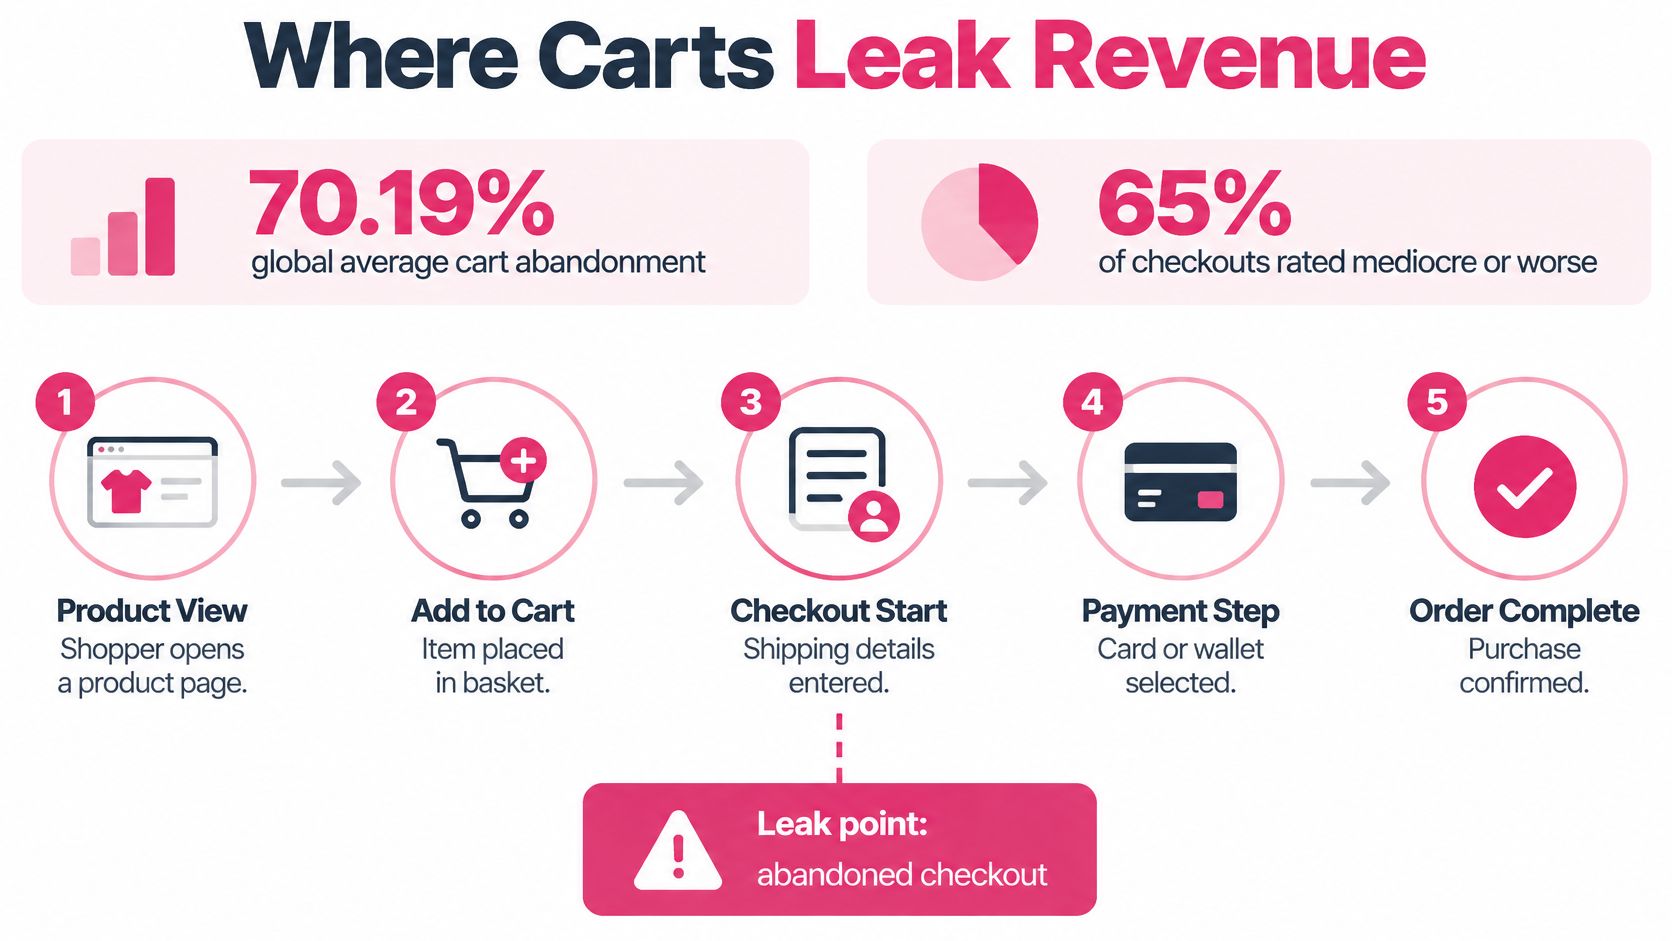
The point of a checkout funnel isn’t the percentage at the end. It’s the step where the percentage collapses.
- Pull 30 days of the funnel. Count shoppers at each step: product view, add to cart, checkout start, shipping details, payment, order complete.
- Split by device and source. Mobile and desktop rarely leak in the same place, and paid traffic abandons differently from returning visitors.
- Tag the causes as separate events. Payment failures, delivery fees appearing late, forced account creation, and slow mobile pages each need their own event, not a shared “abandoned” bucket.
- Rank by lost revenue. Multiply abandoned carts at each step by average order value. A small drop-off at the payment step can outrank a large one at the cart page.
- Fix the top step, then compare. Change one thing, wait two weeks, and compare both abandonment and recovered revenue against the recorded baseline.
| Checkout Step | What Analytics Shows | First Fix to Test |
|---|---|---|
| Cart to checkout | Exits before the shipping form | Simplify the cart summary and show shipping cost early |
| Shipping to payment | Exits after delivery fees appear | Disclose costs sooner or add a free-shipping threshold |
| Account creation | Exits at the sign-in prompt | Offer guest checkout |
| Payment | Failed or declined attempts | Add payment options and clearer error messages |
| Mobile checkout | Higher exit rate on phones than desktop | Test a shorter mobile checkout layout |
The distinction that matters most is friction versus browsing. A shopper who leaves right after delivery fees appear needs transparent pricing or a free-shipping threshold, and sending her a reminder changes nothing. A shopper who added to cart on mobile at 11pm and left at the payment step is a different case entirely, and there a message earns its cost.
Keep a weekly checklist: funnel conversion by device, checkout error rate, average time from add to cart to abandonment, and recovery revenue by message timing. The abandoned cart analysis guide shows how to assemble that view when your store and your messaging tool hold different halves of the story.
Measuring SMS Recovery Without Overcounting
Published ecommerce SMS benchmarks report an average order or conversion rate of 0.27% for SMS campaigns and 1.9% for SMS flows, which makes automated flows roughly seven times higher on that metric (Klaviyo SMS marketing benchmarks). The gap is the whole lesson. Blended reporting that averages one-off blasts with triggered journeys hides which automation is paying for itself.
Split promotional campaigns from triggered flows, then give each flow its own row:
- Messages delivered and delivery rate. A crashed checkout link doesn’t count as a shopper who ignored you.
- Opt-outs. Per flow and per country, not just per campaign.
- Clicks and click-through rate. Directional only, since a click isn’t a purchase.
- Attributed orders and attributed revenue. Labelled as attributed, always.
- Discount cost and message cost. The two deductions most dashboards omit.
- Net revenue. Revenue after both, so the number survives a finance conversation.
Message cost is where estimates creep in. Look up your own per-message price rather than assuming. On CartBoss pricing, one SMS to the United States costs 0.025 €, and sending is billed per message with no subscription, so the cost side of the equation is knowable in advance. The first cart we recover for a store is free, which makes the first test cheap to run.
Run one timing test properly
Keep the audience and the offer identical, then vary only timing: an immediate reminder against a later reminder with a limited discount. Judge the result on conversion per delivered message and revenue per recipient, not clicks, and subtract discount and message costs before declaring a winner. A later message with 15% off can beat an immediate one on orders and still lose on profit.
Benchmarks are not promises. Set your own baseline and write your attribution rules down before you judge whether anything is incremental. The SMS campaign analytics guide covers the reporting template in more depth.
Set a Baseline and Start Tracking This Week
Pick one leak and one channel. Record both before you touch anything else. That’s the decision, and everything below is the execution.
Small stores get less credit than they deserve here. A 2026 survey of 1,008 small retail businesses found that 40% said marketplaces provide “a lot” of useful analytics and 36% said “some”, and the same research describes a documented ecommerce case where privacy-centric implementation increased measurable traffic visibility by about 35% in consent-sensitive markets such as France and Germany (Center for Data Innovation survey on small business and ecommerce). Most small merchants run on platform reporting rather than a custom stack, so better consent design works as a measurement upgrade alongside the compliance benefit.
A weekly review needs less than you’d think.
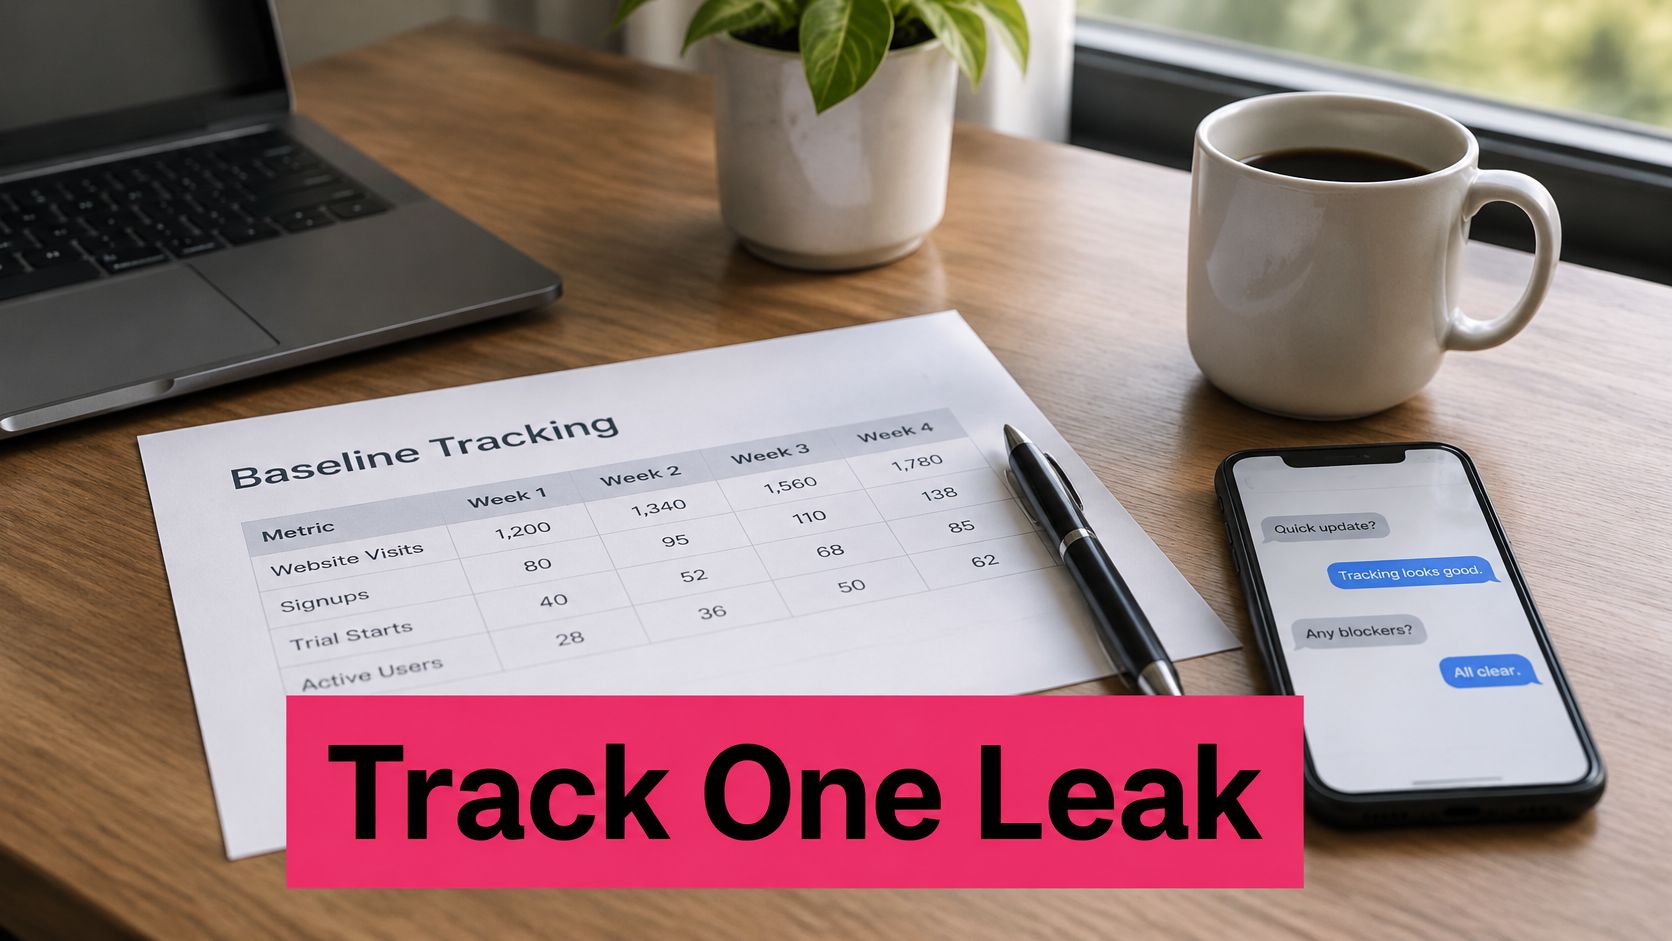
- Record last month’s numbers. Checkout abandonment rate and recovered revenue for the past 30 days, taken from the funnel you already pulled.
- Record the messaging side. Current SMS flow conversion and opt-out rate, per flow, not blended.
- Name one fix. Take the highest-ranked checkout leak from the ranking and write down the change you’ll make.
- Set a holdout on one flow. Assign a randomized slice to receive nothing so incremental lift has a comparison group.
- Review weekly. Note every change against the baseline, and reconcile platform reports against your own order and message data rather than trusting either alone.
CartBoss offers free tools that shorten this step, including a Cart Abandonment Rate Calculator, a Klaviyo SMS Savings Calculator and an SMS Cart Recovery ROI Calculator. Use them to sanity-check your inputs before you commit to a number you’ll defend for a quarter.
The success test is deliberately unglamorous: profit per message rising over four weeks against the recorded baseline, with opt-out rate flat or falling. If profit rises while opt-outs climb, you’ve bought revenue with list quality. If both rise, you don’t have a result yet, you have noise.
For the messaging side of that baseline, CartBoss is an SMS cart recovery tool for Shopify and WooCommerce stores. Once live, its automated recovery engine sends abandoned-cart reminders around the clock, with pre-written and translated messages, automatic language detection, pre-filled checkout forms and dynamic discount application. GDPR and CCPA compliance and automatic do-not-disturb mode come built in, and its detailed analytics and reporting give you the attributed-revenue side to reconcile against your own order data. Connect a store at CartBoss, set the baseline this week, and keep the holdout group in place before you judge the result.