



A shopper clicks your Google ad on Monday, reads a blog post on Wednesday, and leaves a full cart behind on Friday. That evening, they click an abandoned-cart SMS and buy. Your advertising dashboard claims the order, your SMS report claims it too, and you’re trying to decide which budget deserves more money.
Attribution software helps organize that journey. But a useful report needs more than a credit-allocation rule. It needs trustworthy customer data and a way to distinguish purchases that followed a campaign from purchases the campaign added.
Table of Contents
- What Attribution Software Does for Your Store
- Attribution Models Compared Side by Side
- How Data-Driven Models Learn From Customer Paths
- Attributed Conversions Versus Incremental Sales
- Separating Checkout Friction From Message Impact
- Data Quality Checks Before You Choose Software
- Measuring Cart Recovery SMS Without Overstating ROI
- Pick a Model and Run Your First Holdout
What Attribution Software Does for Your Store
Which channel earned that shopper’s sale? The ad introduced your store, the blog helped them evaluate the product, and the text brought them back to checkout. Each interaction served a different purpose.
Think of a restaurant where several servers helped with your meal. Attribution software acts like a system for dividing the tip: it records who participated, then applies a rule to allocate credit. Changing the rule changes the split, not what happened during dinner.

In practical terms, the software collects touchpoint data, including visits, ad clicks, available email engagement events, SMS clicks, and orders. It connects those records where possible and assigns conversion credit to marketing channels. An interaction that wasn’t recorded can’t be recovered by choosing a more advanced model.
Google Analytics launched in November 2005, following Google’s acquisition of Urchin, helping make individual visit, click, and conversion measurement broadly accessible instead of relying primarily on surveys and delayed sales analysis, as described in MarTech Zone’s history of analytics.
The outputs you’ll actually use
Most store owners need these practical outputs:
- Channel reports: See which sources receive credit for orders and revenue.
- Customer path reports: Inspect the recorded sequence before a purchase, including interactions that didn’t close the sale.
- Budget decisions: Compare channel performance before increasing, reducing, or redirecting spend.
Keep the order record as your financial reference. Channel dashboards are different views of that record, not separate pots of revenue you can add together.
The distinction becomes important when several platforms claim the same purchase. Software can explain how it assigned credit, but that explanation alone doesn’t establish what persuaded the customer.
How much credit does each touchpoint deserve, and does that credit reflect what actually caused the sale?
Attribution Models Compared Side by Side
Attribution models differ in where they place credit, which makes each useful for a different business question.
Attribution models compared by credit rule, strength and blind spot
| Model | How it assigns credit | Best for | Main blind spot |
|---|---|---|---|
| First-touch | 100% to the first recorded interaction | Measuring awareness campaigns | Ignores everything that closed the sale |
| Last-touch | 100% to the final interaction before purchase | Simple daily reporting | Overrates branded search and direct visits |
| Linear | Equal share to every touchpoint | Balanced view of long journeys | Treats minor touches as equal to decisive ones |
| Time decay | More credit to touchpoints closer to purchase | Short cycles such as cart recovery | Undervalues early discovery |
| Position-based | 40% first, 40% last, 20% spread across the middle | Common default for mixed funnels | Fixed percentages don’t reflect your real customers |
| Data-driven | Learned from converting and non-converting paths | Stores with enough purchase volume | Modeled credit isn’t proven cause |
| Incrementality testing | Holdout groups estimate the lift a channel adds | Deciding where budget really goes | Needs time, sufficient observations, and clean controls |
Understand the rule before reading the revenue
First-touch resembles crediting the person who introduced you to a restaurant. It helps evaluate discovery, but says nothing about who convinced you to book.
Last-touch credits whoever took your reservation. It’s easy to read, but a shopper searching your brand may already have decided to buy. Our guide to last-click attribution explains that reporting perspective in more detail.
Linear attribution divides the tip evenly among everyone involved. That avoids ignoring intermediate interactions, but treats a casual browse like a decisive checkout click.
Time decay gives a larger share to whoever helped most recently. That can suit cart recovery, although it can make the original introduction look less valuable.
Position-based attribution reserves larger shares for the introduction and closing interaction. It offers a predictable mixed-funnel view, but its fixed allocation is a convention, not a discovery about your shoppers.
Data-driven attribution estimates contributions from recorded paths rather than imposing those fixed shares. Incrementality testing asks a different question altogether: what changes when you withhold the marketing activity?
Choose a working model, not a winner
Use a primary model for daily reporting and a secondary model as a sense check. If the same channel looks strong under different assumptions, investigate it further before increasing spend.
For a short purchasing cycle, time decay or last-touch can provide a practical operating view when paired with a holdout. For longer B2B journeys, position-based or data-driven reporting can help preserve the role of earlier interactions.
Don’t switch models just because another produces more impressive revenue. Keep reporting definitions stable, document changes, and use experiments before making major budget decisions.
How Data-Driven Models Learn From Customer Paths
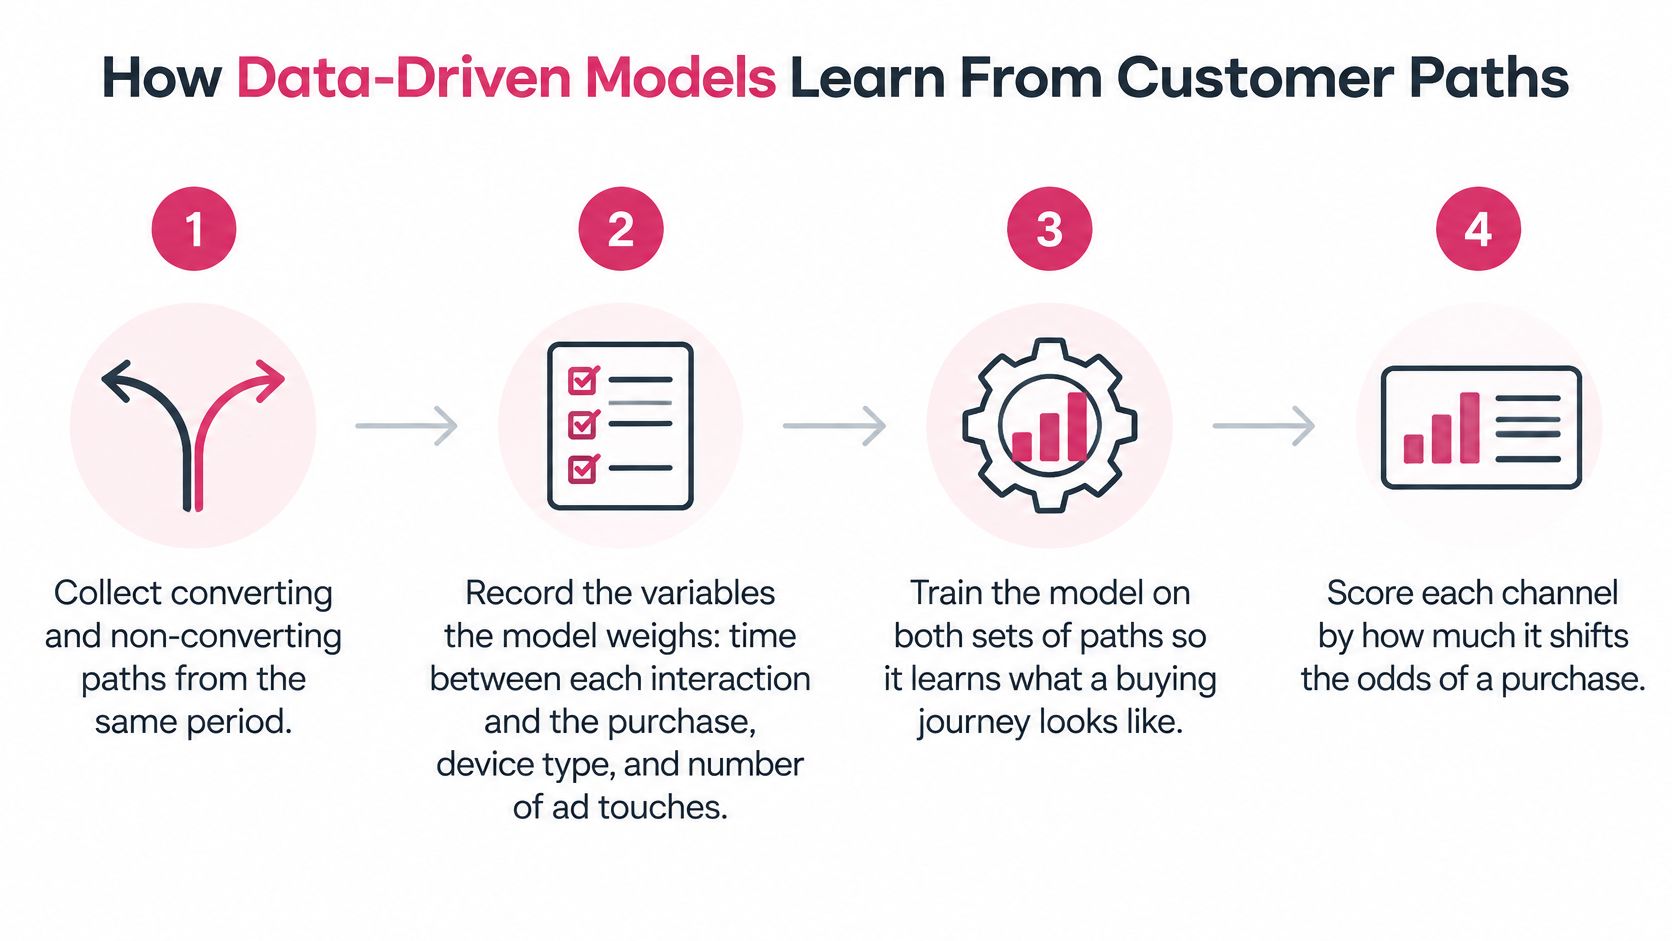
A data-driven model is closer to comparing completed and unfinished recipes than dividing a bill by a fixed formula. It looks for differences between journeys that ended in a purchase and those that didn’t.
Google Analytics’ documentation on data-driven attribution describes using an account’s converting and non-converting paths, considering timing, device type, ad interactions, exposure order, and creative type. Its counterfactual approach estimates how the predicted outcome would change without a particular interaction.
Follow the learning process
-
Collect both kinds of journey from the same period. Include customers who purchased and visitors who didn’t. Feeding the model only successful paths removes the comparison it needs to distinguish common browsing from purchase-associated behavior.
-
Preserve the context around each interaction. Record elapsed time, device, ad-interaction count, exposure sequence, and creative type. A product view immediately before checkout isn’t the same observation as an isolated visit much earlier.
-
Estimate what happens without a touchpoint. The model compares observed outcomes with a hypothetical path where that interaction is absent. This is a modeled comparison, not an actual randomized experiment.
-
Allocate credit using the estimated contribution. Interactions associated with a larger increase in predicted purchase probability receive more credit. The output reflects what the model can learn from the available records and assumptions.
-
Compare the result with last-click reporting. Investigate large shifts before changing budgets. Check whether the difference reflects useful journey information or a tracking change, missing campaign tags, or an unusual promotion.
Preserve events, not just totals
Your event sequence should contain product view, add-to-cart, checkout start, SMS click, and purchase, with the identifiers needed to connect them. A campaign-level revenue total can’t explain where a shopper hesitated or which interaction preceded checkout.
Our explanation of customer journey analytics can help you turn these records into readable paths. Keep the underlying events exportable so you can inspect individual journeys rather than trusting only a channel score.
A low-volume store should be cautious about unstable allocations. For example, a store with only a few dozen monthly orders might see a different channel mix after a handful of unusual purchases; that isn’t a published minimum-volume threshold.
Before trusting the output: confirm purchase is the key event, standardize campaign parameters, retain non-converting journeys, and compare reports over several weeks. Ask whether the result remains understandable when you trace it back to actual orders.
Attributed Conversions Versus Incremental Sales
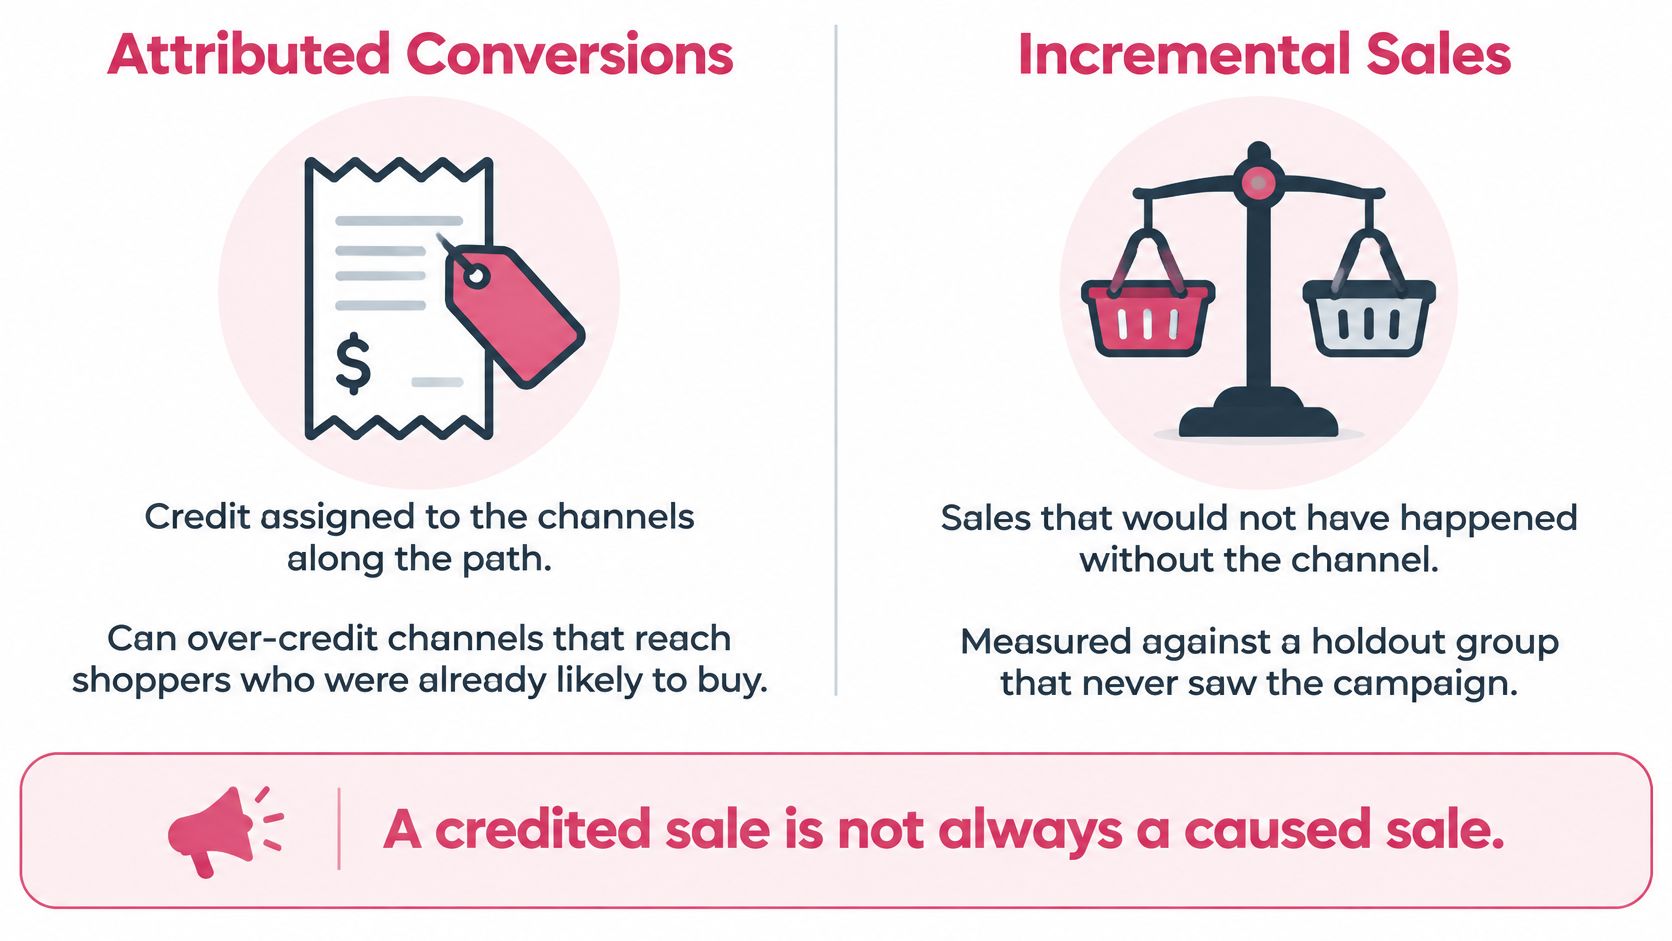
A credited sale isn’t necessarily a caused sale. Put these measures beside each other: attributed conversions are purchases assigned to a channel; estimated incremental conversions are the additional purchases expected because that channel ran.
The difference matters for abandoned carts. A shopper who entered checkout already showed buying intent, so a reminder may receive credit for an order the shopper would’ve completed anyway.
This comparison shows why the measures shouldn’t be interchangeable.
A comparison of nine multi-touch attribution models, using synthetic data and the Criteo and Ali-CCP datasets, found that causal models better addressed user-preference confounding and supported more effective budget decisions, according to SciMag’s account of the model comparison. That finding supports separating observed credit from estimated causal impact, not assuming every causal model is automatically reliable.
Ways to estimate what marketing added
- Randomized holdouts: Randomly withhold a campaign from eligible shoppers and compare outcomes.
- Geo-experiments: Compare outcomes across geographic areas with different marketing exposure.
- Propensity adjustment: Adjust for observed differences in how likely people were to receive marketing.
- Bayesian structural time-series models: Estimate a counterfactual outcome from patterns and suitable comparison signals.
For a store running recovery messages, randomized holdouts provide a particularly direct comparison. Observational adjustments remain dependent on their assumptions and the information available.
Practical rule: A lower recovery result supported by a sound holdout is more useful than a larger claim that includes purchases you would’ve received anyway.
Report attributed conversions alongside estimated incremental conversions. Show an uncertainty interval around the incremental estimate; if attributed totals include modeled or uncertain matching, make that uncertainty visible too rather than implying equivalent certainty.
Recurring lift tests help determine whether the relationship still holds after changes in offers, audience, or timing. The business measure to prioritize is incremental recovered revenue per eligible cart, followed by its profit contribution.
Keep that distinction in mind when reviewing explanations of marketing attribution.
Separating Checkout Friction From Message Impact
A recovery text can’t make an unacceptable delivery date acceptable or remove a mandatory account screen. Before judging a message, establish what prevented the shopper from completing checkout.
Baymard’s checkout abandonment research identifies the following stated reasons among U.S. shoppers who abandoned for reasons other than browsing. These are reasons shoppers reported, not measured causal effects of recovery messages.
Checkout abandonment causes to separate in attribution
| Abandonment cause | Share of abandoners | What attribution should check |
|---|---|---|
| Extra costs such as shipping, taxes or fees | 40% | Compare recovery by cart value with and without fees shown |
| Slow delivery | 20% | Separate delivery-time messages as their own touch |
| Distrust of card security | 19% | Check checkout-stage drop-off by device |
| Required account creation | 18% | Segment guest and account checkouts |
| Checkout too long or complicated | 17% | Track checkout-step exits as events |
Connect the exit to its context
Say paid traffic reaches checkout successfully, but shoppers leave after shipping fees appear. Cutting the acquisition campaign could remove qualified shoppers without fixing the reason they left.
Create segments for paid traffic exposed to checkout fees, guest checkouts on mobile, and carts just below your free-shipping threshold. These groups let you compare shoppers facing similar conditions rather than combining every abandoned cart into a single average.
Avoid turning inferred friction into a claimed customer motive. An exit after the shipping screen is observable; concluding that shipping caused the exit requires more evidence.
Apply a friction-aware workflow
- Tag checkout steps as events. Record when shoppers see shipping charges, delivery estimates, account prompts, and payment errors.
- Segment carts by the friction encountered. Retain cart value, device, acquisition source, and the last completed checkout step.
- Compare recovery within those segments. Use comparable treatment and holdout groups before crediting a message with recovered sales.
If a recovery offer includes free shipping, record that incentive separately from the reminder. Otherwise, you won’t know whether shoppers responded to the communication or the changed purchase terms.
Use these findings to prioritize checkout improvements as well as messaging. A smoother guest checkout may be the right intervention for an account-related exit, while clearer delivery information may help shoppers decide before they abandon.
Data Quality Checks Before You Choose Software
A 2025 practitioner survey found that 25% of marketers use a clear attribution model, while 27% struggle to prove revenue contribution from email and text, according to the State of Marketing Attribution Report. The report also identifies data integration as the leading measurement barrier, alongside missing engagement data and fragmented records.
Start your audit with a manageable order sample, for example 50 orders, rather than a polished demo dashboard. Trace each order through the storefront, campaign events, and attribution report, marking missing interactions and contradictory records.
Before tracing paths, confirm every ad, email, and SMS link carries standardized campaign tags. Our guide to UTM parameters in marketing explains the naming basics; mismatched campaign names can split the same campaign across separate report rows.
Test the records behind the dashboard
The MarTech Intelligence Report on identity resolution platforms identifies incomplete datasets and inconsistent identity matching as important measurement problems. Keep deterministic matches, such as an authenticated customer ID, separate from probabilistic matches, and retain confidence information.
Pre-purchase criteria for attribution software
| Criterion | What to verify | Red flag |
|---|---|---|
| Identity matching | Deterministic and probabilistic rules kept separate, with match confidence recorded | Matches shown with no confidence or rule logic |
| Deduplication | Each order appears once in reconciled revenue, even when campaigns overlap | The same order counted as separate revenue in multiple channels |
| Consent and opt-out | Opt-out status checked before SMS; lawful basis and consent restrictions applied to attribution records | SMS sent to opted-out numbers |
| Event timestamps and timezones | All events normalized to a consistent timezone | Reports mixing local and server time |
| Currency conversion | Revenue converted at a stated rate and date | Totals shown in mixed currencies |
| Refunds and cancellations | Returns and cancelled orders removed from revenue | Revenue reported gross only |
| Model transparency | Vendor explains the model and validates it against lift tests | Proprietary black box with no validation |
Fractional credit across channels is legitimate within a reconciled model. Counting the full order repeatedly and adding those claims together isn’t.
For Shopify or WooCommerce, use consented first-party identifiers where appropriate, such as customer IDs, hashed phone numbers, and order IDs. Hashing doesn’t remove the need for access controls, retention policies, or a lawful processing basis.
Check international comparability
Different currencies, translated campaign names, local timestamps, and consent requirements can make markets look more comparable than they are. Normalize reporting fields while preserving the original currency and local context for inspection.
A simpler, auditable first-party event pipeline can be more useful than an advanced model fed incomplete records. Don’t entrust budget decisions to a tool that can’t explain its matching logic or refund handling.
Measuring Cart Recovery SMS Without Overstating ROI
Don’t build a forecast around the familiar 98% SMS open-rate claim: a ClickMinded review of SMS benchmarks says major reports from Klaviyo, Postscript, and Omnisend don’t publish that benchmark. Use outcomes you can verify instead.
Delivered messages, unique clicks, recovered checkout sessions, completed purchases, revenue per recipient, and opt-out rate provide a practical measurement set. None replaces a controlled comparison of purchase outcomes.
Run a fair holdout
-
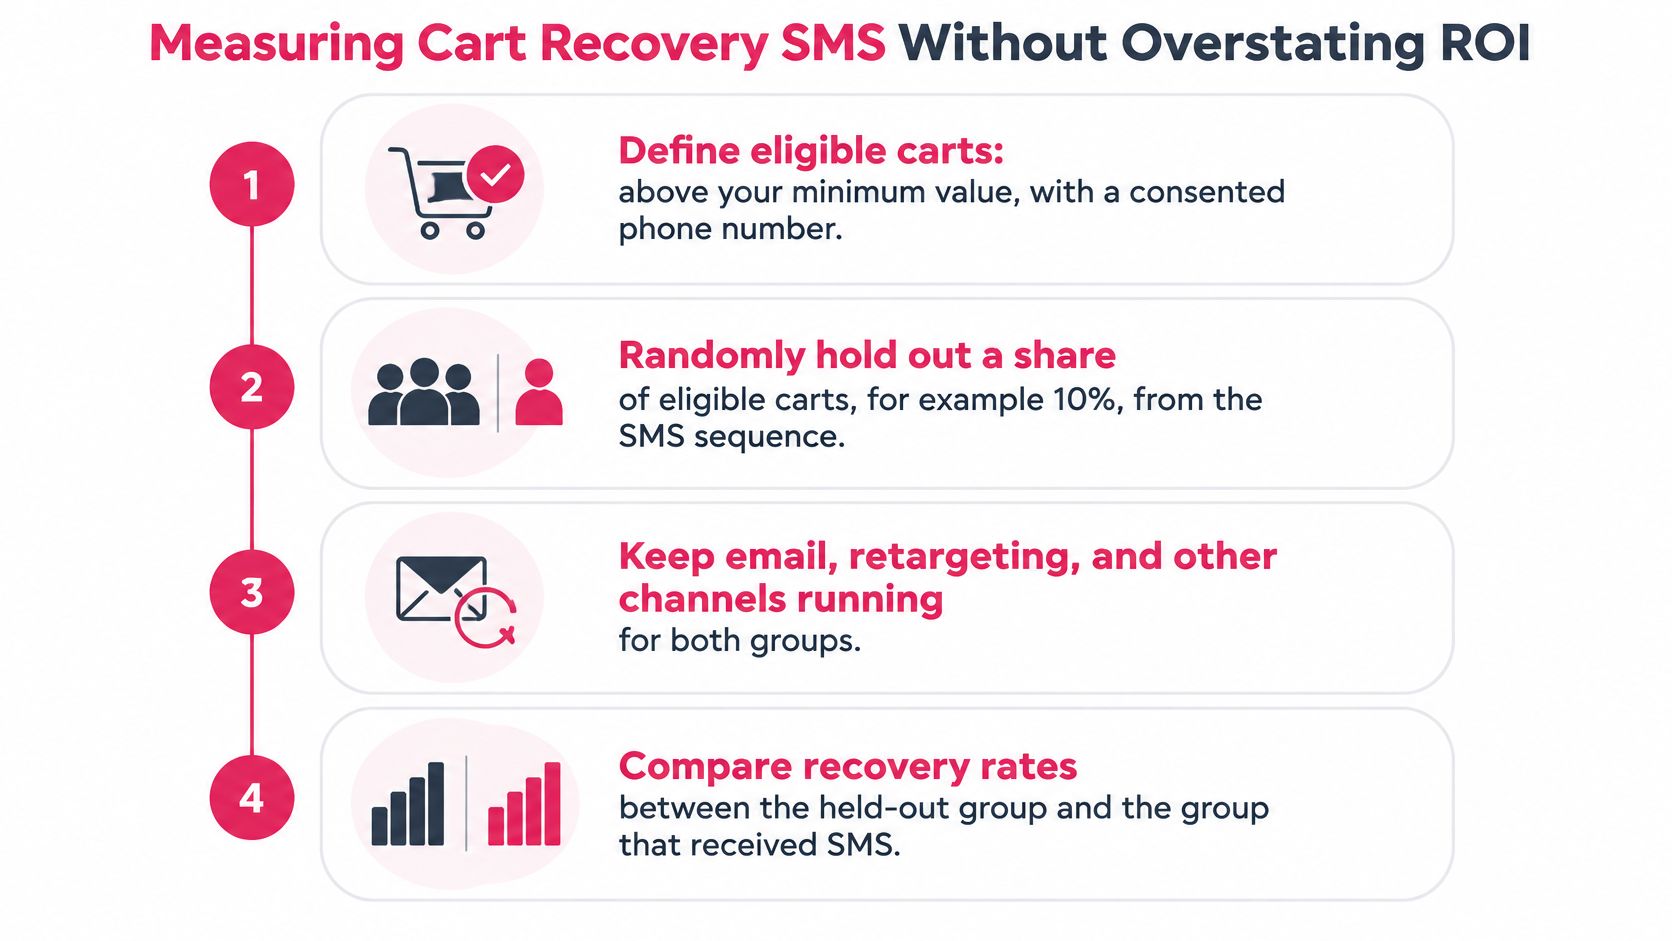
Define eligible carts. Set your minimum cart value and require a consented phone number so both groups represent shoppers you could message.
-
Randomly withhold SMS from a share of eligible carts. For example, you might hold out 10%, with the final allocation chosen through a sample-size calculation rather than treating that example as a universal rule.
-
Prevent control-group contamination. Don’t replace withheld texts with extra email, retargeting, or discounts; either exclude those recovery campaigns from both groups or keep their rules identical across both groups to isolate SMS.
-
Allow purchases time to mature. Predefine the observation window, sample-size requirement, and analysis date using normal purchase delays and the lift you need to detect, rather than stopping when a favorable gap appears.
-
Compare revenue per eligible cart. Divide each group’s net order revenue by its eligible-cart count, then subtract the holdout result from the SMS result to estimate incremental recovered revenue per eligible cart.
-
Translate revenue into contribution profit. Apply product margin and subtract incremental incentive and message costs without double-counting discounts already deducted from revenue; report unsubscribes separately unless you have a defensible monetary estimate.
-
Publish incremental results beside attributed conversions. Include uncertainty around lift so a seemingly positive result doesn’t become a budget decision before it’s distinguishable from normal variation.
Keep repeat shoppers in a consistent assignment to reduce crossover between groups. Honor opt-outs immediately, but retain the original eligible-group assignment for the main analysis so exclusions don’t bias the comparison.
Keep a compact reporting template
Use a report containing:
- Eligibility and assignment: Cart ID, customer identifier, cart value, consent status, and test group.
- Message activity: Send time, delivery status, unique click, and click timestamp.
- Purchase outcome: Recovered checkout session, completion time, net revenue, and original acquisition source.
- Economics and customer response: Discount status, message cost, contribution profit, and opt-out rate.
CartBoss segments end users by purchase completion, cart abandonment, and newsletter subscription. Those events help define reporting groups, but they aren’t a substitute for randomized assignment.
Our automated abandoned-cart, post-purchase, and win-back SMS flows are billed per message, so message expense can be allocated to the test and calculated per recovered cart. Use our guide to calculating SMS marketing ROI to organize costs, keeping attributed revenue and experimentally estimated incremental revenue distinct.
Pick a Model and Run Your First Holdout
Choose software by testing whether you can explain its numbers, not by selecting the dashboard with the highest reported return. A useful purchasing decision starts with your own orders and a measurable recovery flow.
Turn evaluation into an operating routine
-
Repair the data first. Audit tagging, opt-out handling, identity matches, and refunds against your order records. Assign an owner to each failure so unresolved tracking problems don’t become permanent reporting exceptions.
-
Choose your reporting views. Use a primary model for routine channel reviews and a secondary model to challenge the allocation. Write down the conversion definition and attribution window before comparing results.
-
Test your largest eligible recovery flow. Set up randomized assignment before comparing tools on price. Our guide to incrementality testing provides further context for evaluating lift.
-
Schedule a review without forcing a conclusion. For example, review progress after four to six weeks, but continue if your planned sample or purchase window isn’t complete. Prefer a reporting model whose recommendations are consistent with experimental evidence, without treating agreement as proof that every allocated credit is correct.
Use our free SMS Cart Recovery ROI Calculator to model assumptions before committing spend. The SMS Character Counter & Segment Calculator and Cart Abandonment Rate Calculator can help check message length and establish your abandonment baseline.
Consult the blog guidance on when to send abandoned-cart texts before setting timing. Keep timing stable during the experiment so you aren’t changing the treatment while trying to measure it.
Adopt a tool only when its incremental results and its data audit both hold up.
CartBoss offers pay-as-you-go SMS cart recovery, and the first cart we recover for your store is free of charge. Visit CartBoss to explore automated recovery and the free calculators, then evaluate your flow with clean order records and a randomized holdout.