


Repeat purchase rate is customers with 2+ purchases divided by total customers, multiplied by 100, and a large 2026 DTC benchmark across 156,000 customers put it at 18.8%, or roughly 1 in 5 customers buying again within the measured period. If your store only asks whether that number is “good,” you’re asking the wrong question. The useful question is which cohort repeats, and how fast.
Most store owners look at repeat purchase rate as a scoreboard metric. That’s lazy thinking. The metric only becomes useful when you tie it to a time window, a product cycle, and the exact flows that push a first-time buyer into a second order.
A store selling protein powder, a premium apparel brand, and a luxury gifting business should not judge themselves against one flat average. Their buying cycles are different, their customer intent is different, and the path to the second purchase is different. Treating them the same leads to bad decisions, especially around retention spend.
Operators lose money. They stare at blended revenue, feel decent about acquisition, and miss the fact that first-time buyers never come back. Repeat purchase rate catches that problem early.
Table of Contents
- What Repeat Purchase Rate Actually Means
- How to Calculate Repeat Purchase Rate Step by Step
- Realistic Benchmarks by Category and Time Window
- How Repeat Purchase Rate Connects to LTV and Churn
- Best Practices for Measuring Repeat Purchase Rate
- Why SMS and Cart Recovery Lift Repeat Orders Fast
- A Prioritized Playbook to Improve Repeat Purchase Rate
- Common Pitfalls and a Quick Improvement Checklist
What Repeat Purchase Rate Actually Means
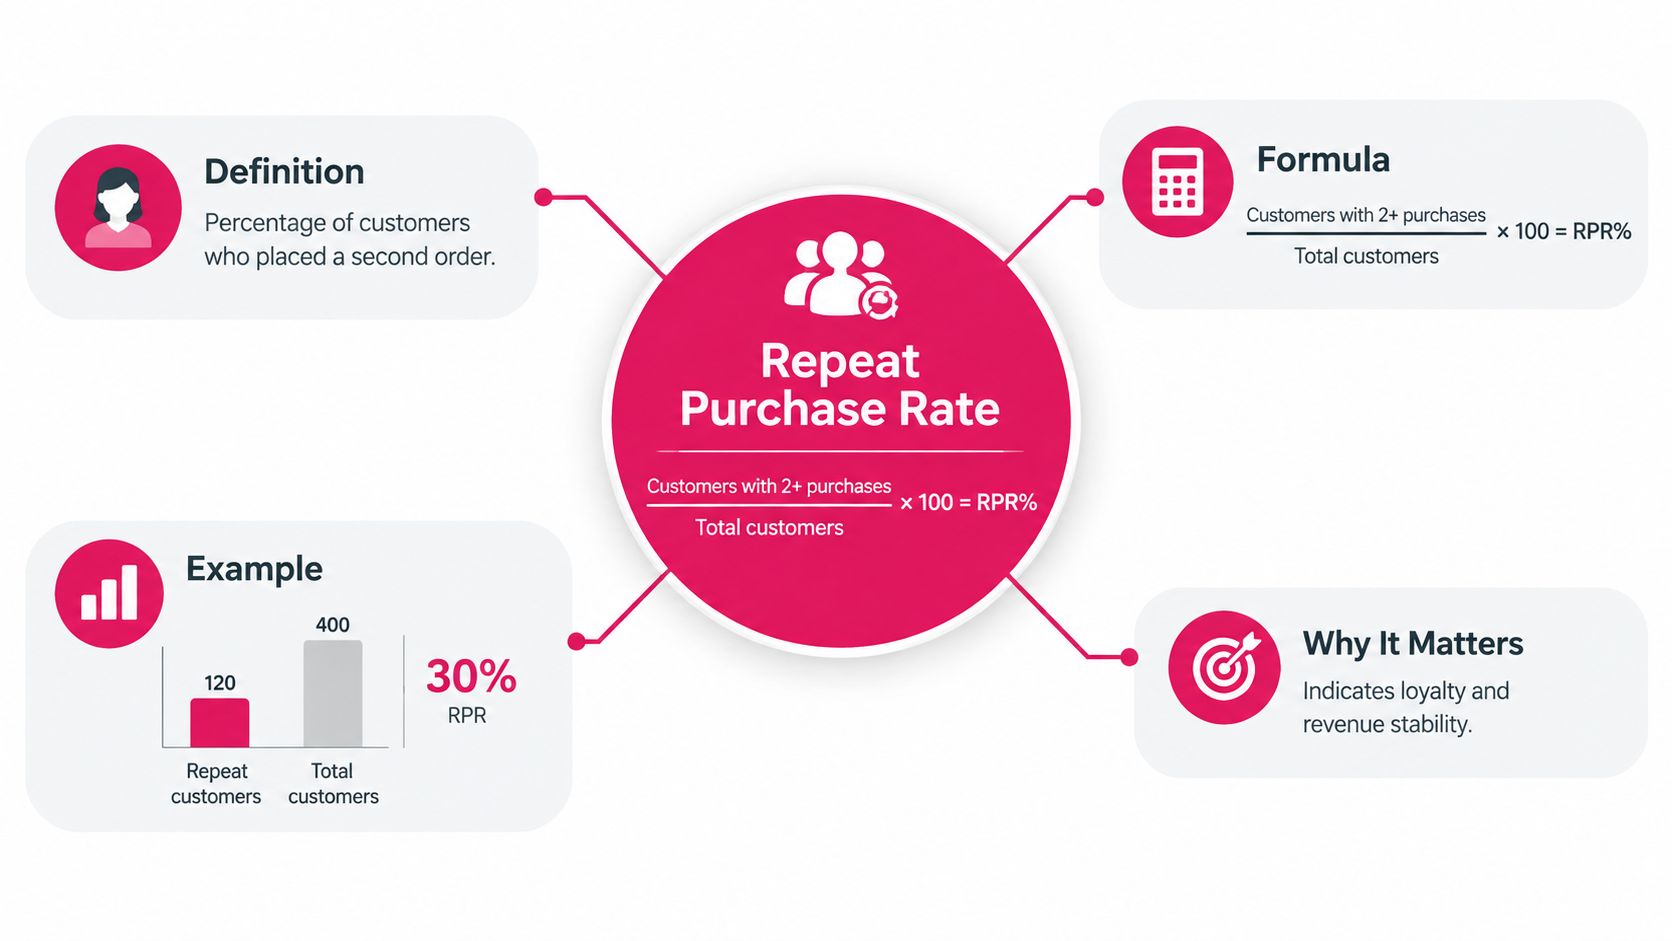
Repeat purchase rate is the percentage of customers who place a second order within a defined period. The standard formula is simple: customers with 2+ purchases / total customers × 100. That’s the version most e-commerce teams use in practice, and it’s also the formula stated in this retention benchmark reference.
A lot of teams confuse this with broader retention reporting. Don’t. A store can post healthy first-order revenue and still have a weak repeat purchase rate if buyers never return. That’s why this metric matters. It shows whether your business is building customer value or renting revenue one order at a time.
What it is and what it isn’t
Repeat purchase rate is not the same as retention rate, reorder rate, or purchase frequency.
- Repeat purchase rate asks whether a customer bought again.
- Retention rate asks whether a customer stayed active over time.
- Purchase frequency asks how often customers buy.
- Reorder rate is often used more loosely and can create messy reporting.
If your team mixes these up, your strategy gets muddy fast. If you want a clean comparison with broader loyalty reporting, CartBoss has a useful breakdown of the customer retention rate formula.
Why the time window changes everything
A cross-store benchmark only means something if the measurement window matches. One large 2026 DTC benchmark based on 156,000 customers found a repeat purchase rate of 18.8% over the measured period, which gives you a concrete baseline for comparison in modern e-commerce contexts, as outlined in this benchmark summary.
Practical rule: If someone gives you a repeat purchase rate without the time window, the number is incomplete.
A 30-day view tells you whether your post-purchase flow works. A 12-month view tells you whether your business eventually gets people back. Those are not the same thing, and smart operators never mix them.
How to Calculate Repeat Purchase Rate Step by Step
This calculation is easy. The mistakes happen in setup, not math.
Use this three-step process
-
Define the customer set
Choose the exact period you want to measure and pull all unique customers who placed at least one order in that window. -
Count repeat customers
From that same set, count how many placed 2 or more orders. -
Divide and multiply by 100
That gives you your repeat purchase rate.
Here’s what it looks like in practice.
Repeat Purchase Rate Calculation Examples
| Store Profile | Total Customers | Repeat Customers (2+ orders) | Calculation | Repeat Purchase Rate |
|---|---|---|---|---|
| Boutique skincare store | 350 | 47 | 47 / 350 × 100 | 13.4% |
| Supplements brand | 12,000 | 2,640 | 2,640 / 12,000 × 100 | 22.0% |
| Premium apparel store | 1,200 | 96 | 96 / 1,200 × 100 | 8.0% |
Same formula. Very different outcomes.
The skincare store might be early-stage, poorly timed on replenishment, or selling products with weak routine adoption. The supplements brand usually has a cleaner replenishment cadence, so second orders are easier to trigger. The apparel store may be dealing with longer gaps between purchases and more seasonal demand.
Where teams distort the number
Before you trust the result, check these three things:
- Lookback window: Are you measuring 30, 60, 90, 180, or 365 days?
- Identity logic: Are customers deduped by email, customer ID, or household?
- Order cleanup: Are refunds, canceled orders, wholesale orders, and one-off gift buyers included?
A messy customer identity rule can turn a measurement problem into a strategy problem.
If you want a closer comparison with related loyalty reporting, the CartBoss guide on how to calculate customer retention rate is worth reviewing.
One more point. Excluding wholesale buyers and obvious gift recipients often changes the story. A blended dashboard can make DTC retention look healthier or weaker than it really is.
Realistic Benchmarks by Category and Time Window
A 25 percent repeat purchase rate can mean you have a healthy retention engine, or a serious problem. It depends on what you sell and how long customers reasonably need before order two.
Analysts at EightX found that healthy e-commerce repeat purchase rates often cluster around 25 percent to 30 percent, with 28.2 percent as one cross-vertical reference point and 35 percent or higher showing up more often in stronger or higher-frequency categories. The Kissmetrics repeat purchase rate glossary points to the other half of the problem: grocery and food delivery can reach 65.2 percent, while luxury goods can sit at 9.9 percent. That spread is too wide for a single benchmark to be useful on its own.
That is why smart operators stop asking, “What’s a good repeat purchase rate?” and start asking, “For which cohort, over what window, in which category?”
Repeat Purchase Rate Benchmarks by Category and Time Window
| Category Tier | Typical 12-Month Range | Examples | Why It Lands There | Best Window to Track |
|---|---|---|---|---|
| High-repeat | 25% to 40% | Pet food, supplements, baby products, household consumables | Replenishment, habit, subscription potential | 30, 60, 90, and 365 days |
| Mid-repeat | 15% to 25% | Apparel, beauty, footwear, home goods | More discretionary buying, trend cycles, partial replenishment | 60, 90, and 365 days |
| Low-repeat | Under 10% | Furniture, electronics, jewelry, luxury gifting | Durability, gifting, high-ticket purchase cycles | 90, 180, and 365 days |
Use the table as a starting point, not a verdict.
If you run consumables and you are stuck at the low end of the range, your second-order system is weak. In plain terms, that usually means poor replenishment timing, weak post-purchase follow-up, or both. If you sell luxury, furniture, or other infrequent-purchase products, a lower repeat rate is normal. The mistake is judging a long-cycle category with a short-cycle scoreboard.
The window matters as much as the benchmark
A 30-day repeat purchase rate and a 12-month repeat purchase rate answer different questions. The first measures how quickly you convert first-time buyers into a second order. The second measures how much of your customer base eventually comes back. Blending them into one number hides the issue.
For stores that want a broader framing on healthy retention by business model, CartBoss breaks that down in its guide to good customer retention rate benchmarks by industry.
Use this rule set:
- Consumables: Judge hard on 30, 60, and 90 days. If order two is late, revenue quality is weaker than it looks.
- Apparel and beauty: Track 60 and 90 days closely, then confirm with 365-day cohorts. Short windows matter, but seasonality can distort them.
- Durables and luxury: Use 90, 180, and 365 days. A low 30-day rate is expected. A weak 365-day rate points to a real retention issue.
The practical takeaway is simple. Benchmark repeat purchase rate by category, then pressure-test it by cohort window. That is the only way to tie the metric to actions that move second-order conversion, especially SMS recovery, replenishment timing, and post-purchase flows.
How Repeat Purchase Rate Connects to LTV and Churn
Repeat purchase rate isn’t a vanity metric. It’s one of the clearest early signals of future customer value.
Why the second order changes the economics
A first order often carries all the acquisition friction. The second order is where trust starts paying you back. When more first-time buyers convert into repeat buyers, your lifetime value profile gets stronger and your acquisition spend gets less fragile.
That’s why weak repeat purchase rate usually shows up before a store notices real damage in blended performance. Teams often react too late because top-line sales still look acceptable.
Repeat Rate Scenarios Compared 15% vs 25%
| Metric | 15% Repeat Rate Scenario | 25% Repeat Rate Scenario |
|---|---|---|
| First-time buyer retention quality | Weak | Stronger |
| Dependence on constant acquisition | Higher | Lower |
| Likelihood of stronger LTV over time | Lower | Higher |
| Churn risk after first order | Higher | Lower |
| Margin pressure from replacing lost buyers | More severe | Less severe |
The point isn’t that one benchmark magically fixes profitability. The point is that a store with more buyers reaching order two has a far better base to build LTV from.
Track repeat purchase rate like a leading churn signal. Waiting for blended LTV to tell you something broke is too late.
If you need a deeper model for how repeat behavior rolls into customer value, CartBoss covers the math in its customer lifetime value formula guide.
What churn looks like in practice
When recent cohorts stop placing second orders, they haven’t just “become inactive.” They’re telling you something specific:
- The product didn’t earn routine use.
- The post-purchase sequence didn’t create momentum.
- Replenishment timing missed.
- Acquisition quality was weak from the start.
That’s why I treat repeat purchase rate as an operating metric, not a reporting metric.
Best Practices for Measuring Repeat Purchase Rate
Most bad retention reporting comes from inconsistent definitions. Fix that first.
Lock the window before you chase the number
Pick a window that matches your product cycle and stick to it. If your team changes between 30-day, 90-day, and 365-day views every month, trendlines become noise.
A clean setup usually includes:
- Short window reporting: Useful for operational fixes like post-purchase flows and replenishment timing
- Cumulative reporting: Useful for understanding the broader customer lifecycle
- Cohort review: Necessary if you want to know whether newer buyers are improving or slipping
One industry summary makes this point well by framing repeat purchase rate as a cohort problem, with reported cohort movement from 8% at 30 days to 28% at 12 months for one period and 31% at 12 months for another, showing how much the answer changes with the window, as summarized in these repeat purchase rate statistics.
Clean the customer definition
You need one customer identity rule across every channel. Otherwise your repeat rate drifts because the same buyer appears as a guest, an account holder, and a mobile checkout user.
Check these areas:
- Guest versus account matching: Merge duplicates where possible
- Subscription logic: Decide whether renewals count the same as standard repeat orders
- Multi-channel orders: Reconcile store, marketplace, and direct orders carefully
- Refund and chargeback handling: Exclude non-valid orders from the numerator
If you sell across marketplaces, retail, or wholesale, it also helps to review broader operational setup guides. Loyaltie’s selling on guide is a useful resource for thinking through channel structure before you benchmark DTC behavior.
Set a reporting rhythm
Use a simple cadence:
- Weekly snapshot: Spot sudden issues fast
- Monthly cohort review: See whether new customer quality is improving
- Quarterly benchmark reset: Re-evaluate category expectations and lifecycle timing
Stable definitions beat fancy dashboards. Every time.
Why SMS and Cart Recovery Lift Repeat Orders Fast
Analysts cited earlier found that a large share of repeat purchases happen soon after the first order. That is why stores that want a faster lift in repeat purchase rate should focus on the first 30 to 45 days, not broad retention campaigns six months later.
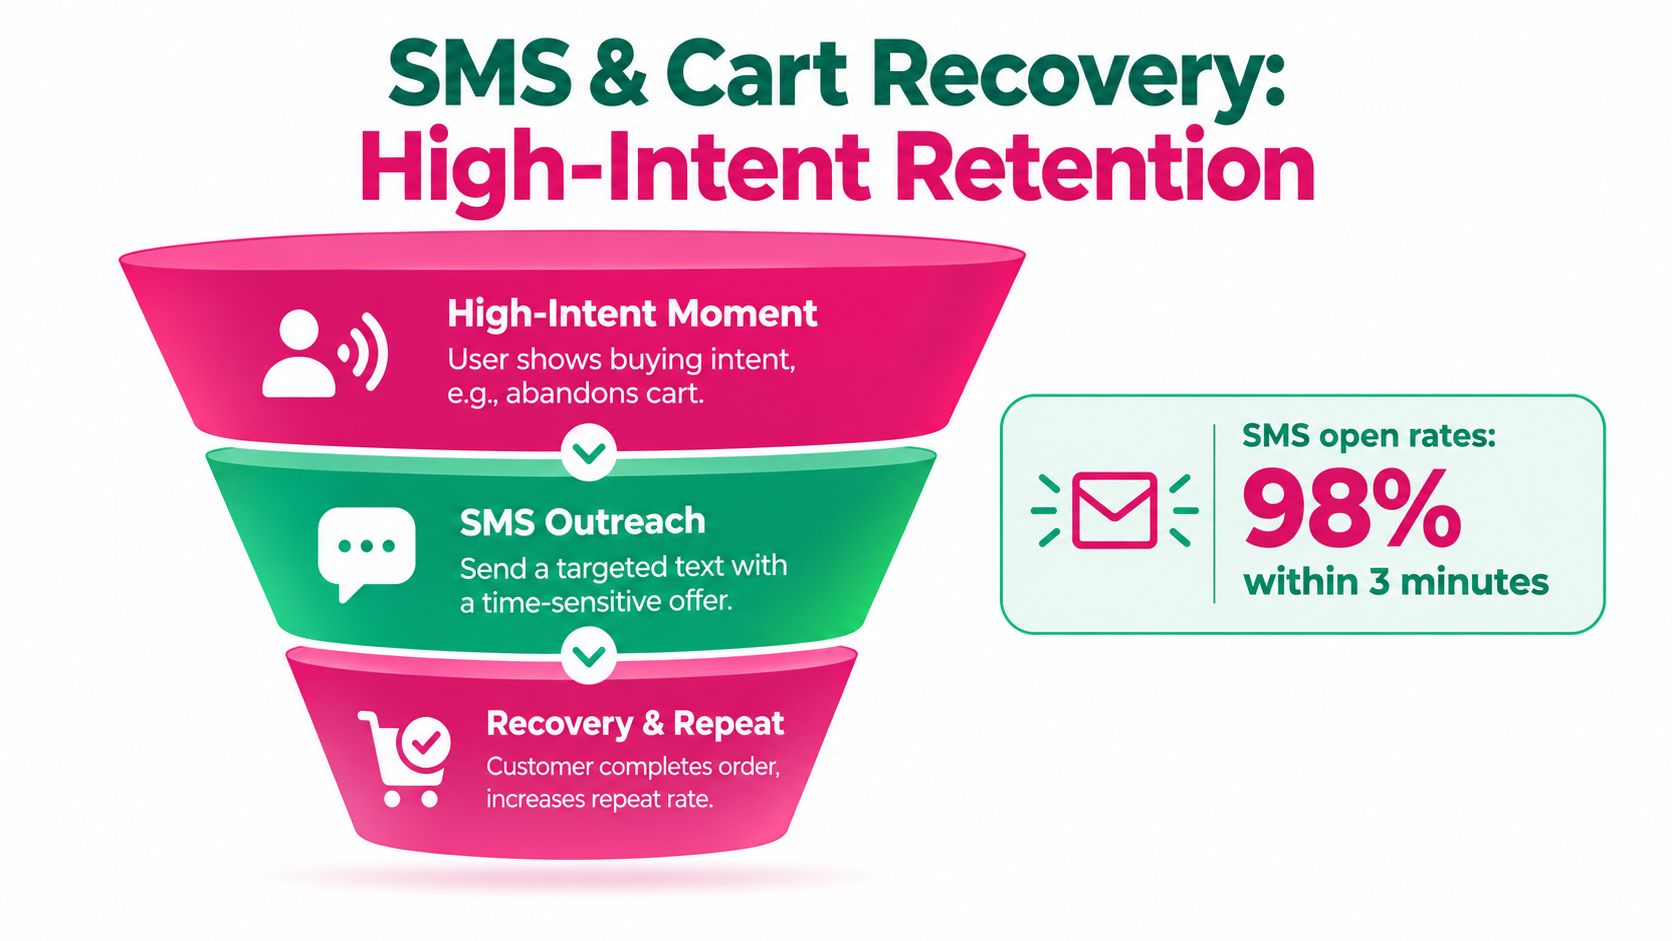
SMS works because timing beats volume. A text sent minutes after cart abandonment or shortly after delivery reaches the customer while intent is still active. Email still has a role, but SMS is the better tool for narrow windows where speed matters.
Retail and e-commerce SMS open rates typically land in the 95% to 98% range, and click-through rates are often around 8% to 14%, according to this SMS benchmark summary. Those numbers matter because repeat purchase rate is a time-window problem. If your best second-order opportunities happen inside a short window, the channel that gets seen first usually wins.
Where SMS helps most
Use SMS at the points that directly affect second-order conversion:
- Cart recovery: Recover the first order quickly so the customer can enter the repeat purchase cycle at all
- Post-delivery replenishment: Time the message to expected product usage, not your promo calendar
- Win-back campaigns: Reach one-time buyers before they drift too far past their likely reorder window
- Second-order incentives: Give recent first-time buyers a simple reason to place order two
For stores comparing retention channels, CartBoss has a practical breakdown of SMS marketing for customer retention.
This short video walks through retention-focused messaging, including how to set up a post-delivery SMS sequence that pushes customers toward a second order.
Fast channels expose weak timing
The payoff is not just message visibility. SMS forces better lifecycle timing.
A generic discount blast to all past buyers will not do much for repeat purchase rate. A replenishment text sent near the expected usage point can. A cart reminder sent an hour after abandonment can. A post-delivery check-in that answers product questions can. All three are tied to a specific customer moment, and that is what moves second-order conversion.
Stores raise repeat orders faster when they match the message to the buying window, not when they simply send more campaigns.
In tool terms, CartBoss is one option for automated SMS cart recovery and win-back messaging if you want a system that triggers texts without manual campaign work.
A Prioritized Playbook to Improve Repeat Purchase Rate
Most stores don’t need more ideas. They need a tighter order of operations.
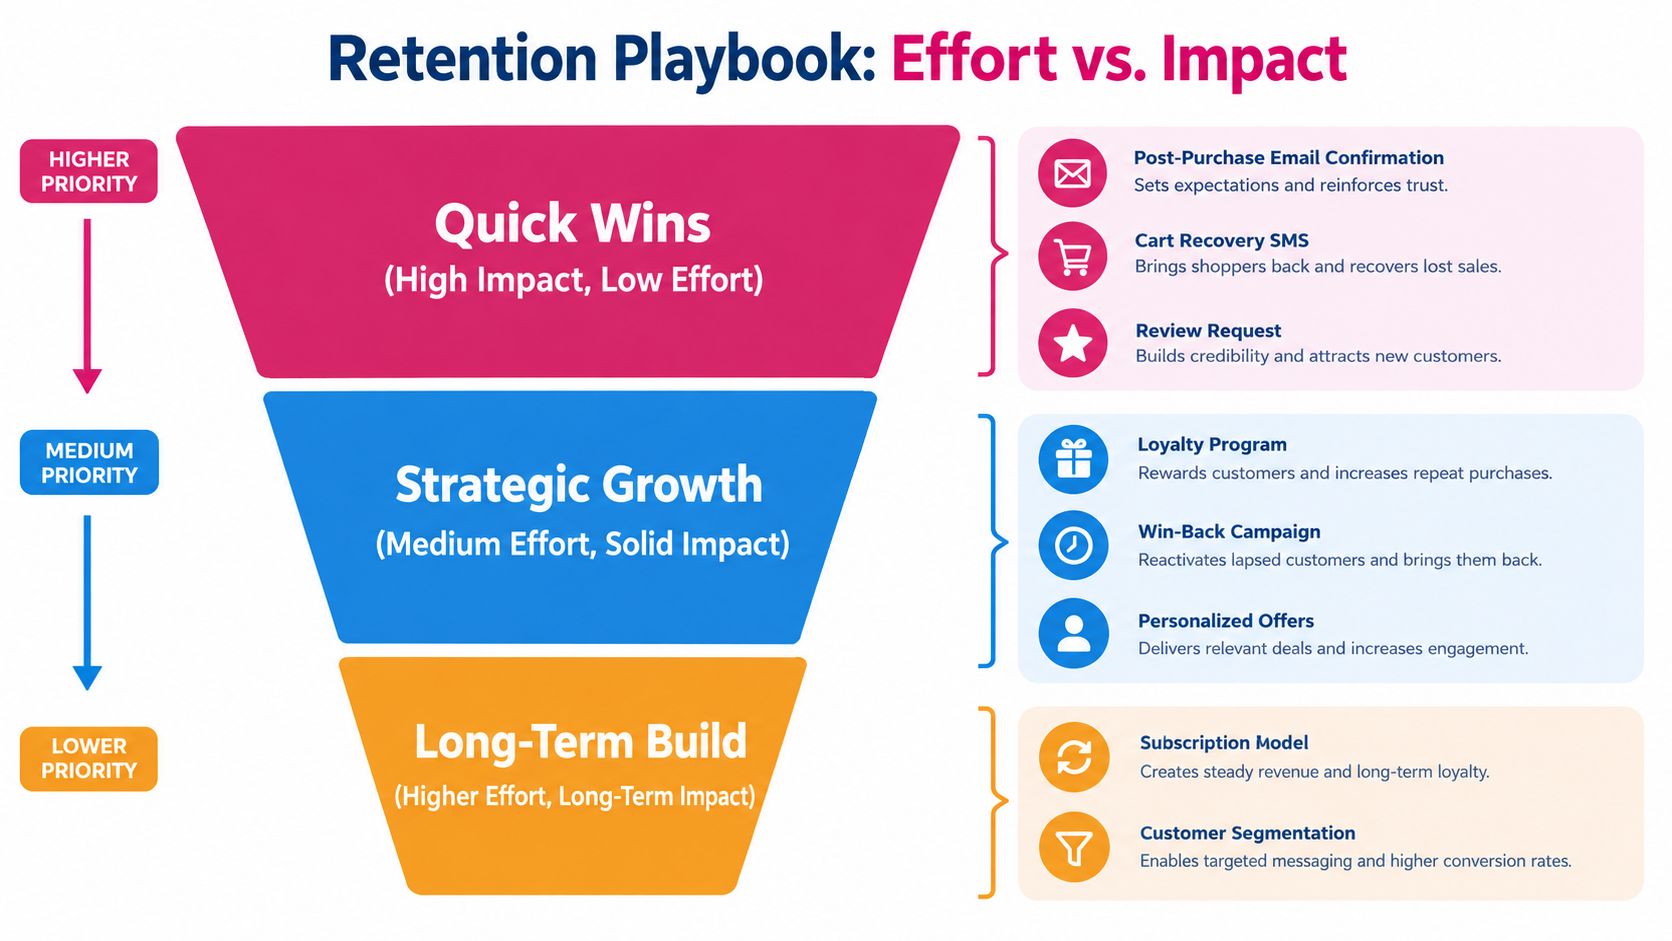
Quick wins first
-
Tighten the post-purchase confirmation flow
Confirm the order, set delivery expectations, and tell the customer what happens next. This sounds basic because it is basic. Stores still mess it up. -
Launch cart recovery SMS
If people abandon before the first order, your future repeat purchase rate never gets the chance to exist. Recover the sale first. -
Add a review request after delivery
Reviews create re-engagement. They also reveal whether the first product experience is strong enough to justify a second order.
Medium-effort moves that usually pay off
-
Set replenishment reminders by product type
Consumables need timing, not generic promotion. Build reminders around expected product use, not your campaign calendar. -
Create a second-order VIP
Give buyers a reason to cross the line from first purchase to repeat purchase. Early access, bundle perks, or loyalty entry all work if they’re clear. -
Build a basic win-back flow
Trigger messaging for one-time buyers who pass the expected repurchase window. Keep the offer simple and the copy direct.
Higher-effort systems worth building
-
Use product recommendations inside browse and post-purchase flows
This matters most in style-driven catalogs. If you sell fashion, category-based product suggestions for clothing can help shape a smarter recommendation setup instead of generic “you may also like” blocks. -
Rebuild retention around customer segments
Segment by product line, first-order source, and expected reorder speed. A buyer who came in through a discount campaign should not get the same second-order sequence as a buyer who found you organically.
The dashboard metrics to watch
Use a short list:
- Second-order conversion by cohort
- Time to second purchase
- Repeat purchase rate by product line
- SMS opt-in growth
- Revenue from replenishment and win-back flows
- Second-order AOV versus first-order AOV
This is the part that often gets skipped. After launching tactics, measuring everything at the store level teaches nothing. Watch the second order directly.
Common Pitfalls and a Quick Improvement Checklist
The biggest mistakes aren’t strategic. They’re operational.
What quietly breaks the metric
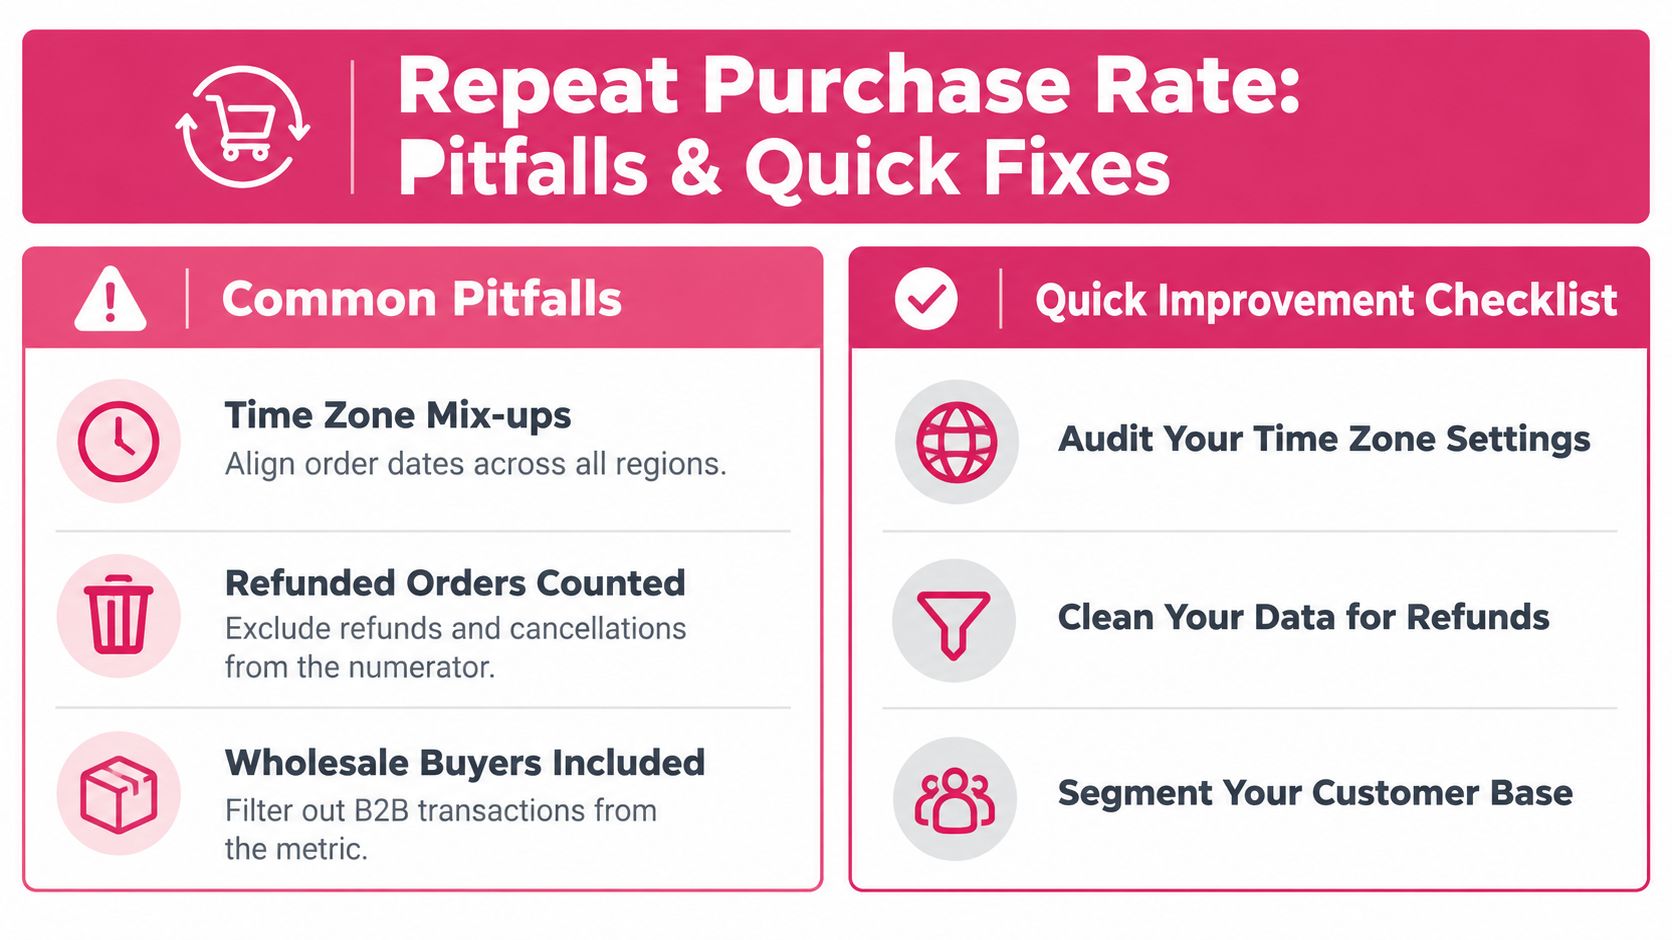
- Time zone mismatch: Orders placed near midnight can fall into the wrong reporting day or month.
- Refunded orders counted as repeats: That inflates the numerator and gives you false confidence.
- Wholesale mixed into DTC reporting: B2B buyers can distort behavior badly.
- Using a 365-day window too early: Young stores often don’t have enough history for that to be a clean comparison.
- Forcing one benchmark on every category: A replenishable product and a durable product should not be graded the same way.
Quick checklist for next quarter
Run this audit and stop guessing:
- Audit your cohort window: Make sure your reporting period matches your product cycle.
- Separate DTC from B2B: Keep wholesale and bulk buyers out of your core retention dashboard.
- Segment by product line: Some categories inside the same store repeat far better than others.
- Segment by acquisition source: Weak acquisition quality can crush repeat rate later.
- Set one SMS trigger this month: Start with cart recovery or replenishment.
- Set one email flow this month: Post-purchase onboarding is usually the right first move.
- Compare second-order AOV to first-order AOV: Repeat growth that depends on margin-killing discounting isn’t healthy retention.
A “good” repeat purchase rate isn’t one number. It’s a clean measurement, in the right window, tied to actions your team can actually control.
If you fix the measurement, the playbook gets obvious. If the measurement is sloppy, every retention decision after that gets weaker.
CartBoss helps e-commerce stores recover abandoned carts and re-engage buyers with automated SMS, which makes it directly useful when you’re trying to improve first-order recovery and push more customers toward a second purchase. If your repeat purchase rate is soft because buyers drop off early, visit CartBoss and look at how SMS cart recovery and win-back flows fit into your retention stack.