



The most popular SMS marketing advice starts with how many people supposedly read a text. That’s the wrong place to start a budget decision. A useful report should tell you whether messages reached eligible shoppers, what those shoppers did next, and how much additional profit the store earned.
SMS marketing analytics should separate credited sales from sales you added. It should also show whether today’s conversions came at the expense of tomorrow’s subscriber base. That means treating consent, delivery failures, discounts, and opt-outs as part of the economics, not as notes beneath a revenue chart.
Table of Contents
- The SMS Metrics That Matter and How to Calculate Them
- How to Set Up Tracking Before Your First Send
- Attributed Sales Versus Incremental Revenue
- A Worked Example of a Cart Recovery Report
- Consent, Opt-Outs and Fatigue as Revenue Signals
- Reading Results from Symptom to Fix
- Audit One SMS Flow This Week
The SMS Metrics That Matter and How to Calculate Them
Standard SMS doesn’t generate an open event. A 98% SMS open rate therefore isn’t directly verifiable like an email open rate, a distinction explained in SMSComparison’s SMS statistics guide. Don’t use an estimated reading figure as your main measure of engagement.
Start with observable events instead. Record delivery, clicks, checkout activity, orders, revenue, and withdrawals of permission, then connect them through consistent identifiers.
Core SMS analytics metrics and formulas
For percentage rates below, multiply the result by 100. Keep revenue figures in your store’s reporting currency.
| Metric | How to calculate | What it tells you | Watch for |
|---|---|---|---|
| Delivery rate | Delivered messages ÷ messages sent | Whether carriers accept your messages | Drops in automated flows compared with one-off sends |
| Click-through rate | Clicks ÷ delivered messages | Whether the message earns attention | Clicks that never reach checkout |
| Checkout start rate | Checkout starts ÷ clicks | Whether the link lands on a usable page | Shipping or fee surprises at checkout |
| Conversion rate | Orders ÷ delivered messages | Share of recipients who buy | Purchases that would have happened anyway |
| Revenue per recipient | Revenue ÷ recipients in the eligible group | The value of the audience, not the send count | Averages hiding a few strong campaigns |
| Unsubscribe rate | Opt-outs ÷ delivered messages | Message fatigue or an unclear offer | Sudden spikes after a new flow or higher frequency |
| Incremental revenue | Revenue from the message group minus revenue from the holdout group | Revenue the message actually caused | Holdout groups too small to read |
Normalize the holdout revenue to the message group’s size before subtracting. Otherwise, a larger message group could appear to generate lift because it contains more shoppers.
Also label the revenue numerator: attributed, total observed, or incremental. Those figures answer different questions even when the denominator stays unchanged.
Check the arithmetic before comparing performance
Suppose a campaign delivers 4,000 messages, records 160 clicks, and receives 36 attributed orders. Its click-through rate is 160 ÷ 4,000 × 100 = 4.0%, while its delivered-message conversion rate is 36 ÷ 4,000 × 100 = 0.9%.
Those are hypothetical calculations, not benchmarks. Counting orders against clicks instead would answer a different question, so write the denominator beside every rate.
Reporting rule: A percentage without a denominator isn’t ready for a budget meeting.
Split results by message purpose, consent source, country, and lifecycle stage. A cart reminder should be judged on recovered orders, revenue, incentive cost, and opt-outs, while a post-purchase service message needs a different success definition. Keep one dashboard with these measures per message type and review it weekly.
How to Set Up Tracking Before Your First Send
Build the reporting rules before launching the flow. If you change naming, timing, and attribution settings after orders arrive, you won’t know whether shoppers behaved differently or your reporting did.
Establish a repeatable tracking routine
-
Tag every message by purpose. Use separate labels for cart recovery, post-purchase communication, and promotions, with a distinct name for each flow. A generic SMS label blends unlike journeys and makes comparisons harder to interpret.
-
Preserve the permission record. Store the phone number, signup source, date and timestamp, exact wording shown, and intended campaign purpose. The ICO’s PECR guidance explains that consent generally needs to be specific, informed, freely given, and expressed through a positive action, so a subscribed flag alone isn’t an adequate audit trail.
-
Give each flow identifiable links or codes. Use consistent UTM values for source, medium, and campaign, and avoid sharing one discount code across unrelated flows. Follow the CartBoss conversion tracking guide to connect message interactions with store events, without treating that connection as proof of causation.
-
Record the initial reminder timing. CartBoss sends the first SMS cart reminder 15 minutes after a visitor leaves their cart. Keep that baseline documented before testing longer delays, rather than changing timing whenever a short reporting period disappoints.
-
Randomize a no-message control group. As an illustrative setup, you could reserve 10% of eligible shoppers, then assess whether that allocation produces enough orders for a useful comparison. Don’t select the control from shoppers who already look less likely to buy, and don’t assume that a small allocation guarantees adequate statistical power.
-
Fix the attribution window in advance. For example, you might count qualifying purchases within seven days after a click, provided that fits the buying journey. Record both the qualifying action and the window, and don’t extend either after seeing weak results.
-
Separate operational reporting from lift measurement. Track the six funnel and audience metrics by message type and country, with incremental revenue alongside them when the experiment can support it. Pooling markets can hide language problems, different permission sources, and uneven delivery conditions.
Use this checklist to make the implementation repeatable.
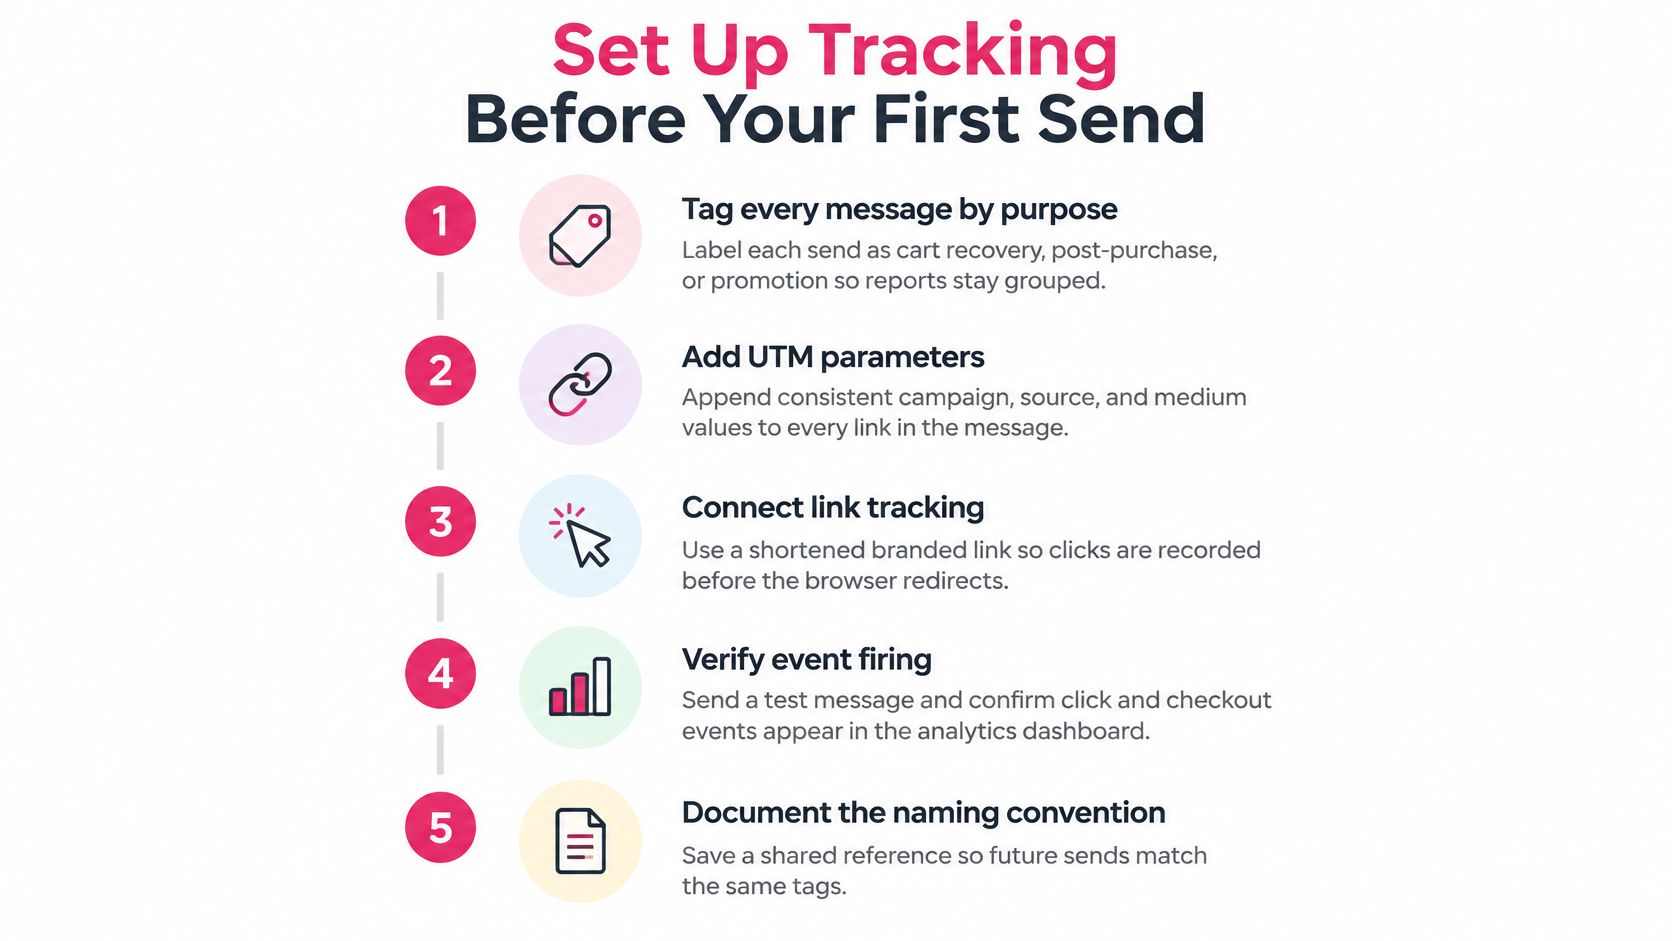
Before launch, open a test message on a phone and follow its link through checkout. Confirm that the redirect preserves tracking parameters, the expected events appear, and the resulting order can be reconciled with the store’s order record. Save the naming convention and test results where everyone building messages can find them.
Attributed Sales Versus Incremental Revenue
A purchase credited to a text isn’t necessarily a purchase caused by that text. The shopper might have returned after an email, another browsing session, or by remembering the product.
Keep that distinction in mind when reviewing a shopper’s path from message to purchase.
Attribution assigns credit under a rule. Incrementality estimates the difference the message made. The CartBoss marketing attribution guide provides context for understanding credit assignment, but a randomized comparison is needed to estimate causal lift.
Attributed reporting versus incremental reporting
| Question | Attributed reporting | Incremental reporting |
|---|---|---|
| Who gets credit | Any order within the attribution window after a click | Only orders above the rate of the holdout group |
| Window rule | Fixed in advance, often by click date | Fixed in advance and compared with the holdout over the same period |
| Cost of measuring | None beyond tracking links | A withheld control group that gets no message |
| Best use | Rough channel comparison | Budget decisions and discount depth |
Attributed reporting remains useful for checking which messages precede purchases. It’s weaker evidence for deciding whether to increase spend, particularly when several channels can claim the same order.
Calculate the lift, not just the credited orders
Consider a hypothetical experiment. 2,000 shoppers receive the message and convert at 1.2%, producing 24 orders; 1,000 holdout shoppers convert at 0.9%, producing 9 orders.
The difference is 0.3 percentage points. Applied to the message group, that’s 2,000 × 0.003 = 6 incremental orders, not 24.
At the holdout rate, you’d expect 18 orders from an equally sized group without the message. The remaining six are the estimated addition, subject to uncertainty.
Credited orders describe what happened after a message. Incremental orders estimate what happened because of it.
Don’t treat that small hypothetical difference as conclusive. Predefine the minimum effect worth detecting, assess sample size using the baseline conversion rate, and report uncertainty around the result. A few dozen orders can leave a wide range of plausible outcomes.
Use the same distinction when evaluating demonstrations and performance reports.
Keep these outcomes separate:
- Delivered-message conversion: Attributed orders divided by delivered messages.
- Incremental conversion: The conversion-rate difference between randomized groups.
- Recovered gross profit: Incremental economics after product costs, discounts, and messaging costs, with the cost treatment stated.
- Assisted conversions: Purchases associated with SMS inside the predefined window, without claiming exclusive credit.
Finally, don’t allocate budget from a blended average alone. The 2025 benchmark evidence summarized by Zobi reports that the top 10% of SMS campaigns generated roughly seven times the average revenue per recipient. Segment by audience, timing, and offer to identify what’s repeatable rather than letting a few exceptional campaigns set expectations for every flow.
A Worked Example of a Cart Recovery Report
A cart recovery report should show both what followed the message and what changed against a no-message comparison. In this hypothetical month, the store records 5,000 eligible abandoned carts. Of these, 3,600 shoppers receive a delivered text and 400 enter a no-message holdout. The remaining 1,000 are outside the test, so the operational report should give their exclusion reason rather than count them as failed deliveries.
Follow shoppers through the funnel
The text group records 900 clicks, or 25% of delivered messages. Those clicks produce 270 checkout starts, a 30% click-to-checkout rate, and 108 orders, a 3.0% delivered-message conversion rate. The holdout records 8 orders from 400 shoppers, or 2.0%.
Assume an $85 average order value before the recovery discount in both groups. The table separates text-group activity from the holdout and shows the estimated lift, rather than presenting attributed orders as incremental ones.
Cart recovery month at a glance
| Measure | Text group (3,600 delivered) | Holdout (400 shoppers) |
|---|---|---|
| Clicks | 900 (25%) | Not applicable |
| Checkout starts | 270 (30% of clicks) | Not applicable |
| Orders and conversion | 108 orders (3.0%) | 8 orders (2.0%) |
| Incremental orders | 36 | Comparison group |
| Incremental revenue before discounts | $3,060 | Comparison group |
| Net before message costs | $2,142 | Comparison group |
The attributed view assigns the text flow 108 × $85 = $9,180 before discounts. That total includes orders that may have happened without the text. At the holdout’s 2.0% rate, an estimated 72 of the 3,600 text-group shoppers would have ordered anyway.
The estimated incremental difference is therefore 36 orders, calculated as 3,600 × (3.0% − 2.0%). At the assumed order value, incremental revenue before discounts is 36 × $85 = $3,060. This is a comparison-based estimate, not the full attributed total.
Charge the discount to every redeemed order
Suppose all 108 text-group buyers use a 10% recovery discount. The discount cost is $918, including discounts on the 72 orders that the holdout rate suggests would likely have occurred anyway.
- Incremental revenue before discounts: $3,060.
- Discount cost across all attributed orders: $918.
- Net before message costs: $3,060 − $918 = $2,142.
That $2,142 is not profit. Product costs, messaging charges, and other variable costs remain to be deducted. If the reported revenue already reflects discounts, subtracting the discount again would understate the result.
Retain the flow provisionally, then test a smaller incentive or a shipping-expectation message before increasing frequency. The report supports testing whether the offer’s cost can fall while the estimated incremental lift holds. It does not justify treating every attributed order as revenue caused by SMS.
Consent, Opt-Outs and Fatigue as Revenue Signals
An opt-out removes someone from your future SMS marketing audience, not from your entire customer base. Treat it as a warning about lost channel opportunity, then measure whether repeat purchases and contribution change rather than assuming a fixed lifetime revenue loss.
For UK marketing texts, the ICO’s direct marketing guidance says senders must identify themselves and provide a clear, easy opt-out opportunity in each message. Include the brand and an actionable instruction such as Reply STOP to unsubscribe, rather than relying on a hidden preferences page.
Check permission and suppression before sending
- Verify affirmative consent. CartBoss requires consent from every end user before messaging through the service. Check that permission covers the sender and message purpose, rather than relying on a preselected box.
- Retain the evidence. Keep the signup source, timestamp, wording, and campaign purpose attached to the subscriber record.
- Inspect the actual message. Confirm that the brand identity and functioning unsubscribe mechanism survive template edits.
- Apply local restrictions. CartBoss prohibits marketing at unlawful times, for example between 9 p.m. and 8 a.m. in the recipient’s time zone, and prohibits marketing to recipients below the applicable legal age.
Capture withdrawal requests, suppress the number immediately, preserve the suppression record, and exclude it from scheduled, triggered, and promotional sends. Test STOP replies, unsubscribe links, and customer-service requests against the same process. Sending after someone opts out is prohibited under CartBoss’s messaging rules.
For U.S. messaging, the FCC’s consent-revocation publication states that revocations must be honored within a reasonable time, no later than 10 business days, and any permitted confirmation text must contain no marketing. Use immediate suppression as your operational target, not the maximum legal response period.
Read subscriber health alongside revenue
A 2025 benchmark dataset cited by StatisticsGlobal reports 96.6% deliverability for campaigns versus 92.8% for automations; the same compilation reports consumer guidance that 73% of users unsubscribe when messages become too frequent. These figures justify separate monitoring, not universal targets for your store.
Track these signals by country and consent source:
- Contact pressure: Messages received over seven-day and thirty-day periods, including overlapping flows.
- Audience retention: Opt-out probability by segment, complaints, and repeat-purchase behavior.
- Economic quality: Profit after incentives and revenue per eligible subscriber, including people whose messages weren’t delivered.
Use frequency capping to control combined exposure, not just the spacing inside one automation. Flag flows where conversions increase alongside withdrawals, then test whether fewer messages preserve contribution.
Permission check: A low unsubscribe rate doesn’t prove valid consent. Make withdrawal as easy as signup.
The long-term question isn’t whether a flow converted. It’s whether the store earned more after accounting for discounts, delivery deterioration, and changes in future purchasing.
Reading Results from Symptom to Fix
Read the funnel from delivery through purchase, with opt-outs alongside it. Use the pattern to choose an investigation, not to declare a cause before testing.
| Symptom | Likely cause | Fix to test first |
|---|---|---|
| Delivered but few clicks | Generic message with no specific product or reason to act | Name the product and remove one specific friction point in the message |
| Clicks but few checkout starts | Link opens the cart page, not a pre-filled checkout | Test a pre-filled checkout link against the cart page link |
| Checkout starts but few orders | Shipping cost or delivery time shown too late | Show a delivery estimate in the SMS and audit shipping disclosure |
| Unsubscribe rate rising | Too many sends or an unclear offer | Cap frequency at 7-day and 30-day limits and tighten targeting |
| Revenue up, profit flat | Discounts paying for sales that would have happened | Compare profit after incentives per eligible subscriber |
| Delivery rate falling | Invalid numbers or carrier filtering in automated flows | Clean the list and check sender identification before sending |
Match the message to the actual obstacle
When delivered messages generate few clicks, inspect the copy and targeting together. A generic reminder gives shoppers little reason to return if their original objection remains unresolved.
Checkout friction deserves particular attention. The Baymard Institute’s abandonment breakdown reports 40% citing extra costs, 20% slow delivery, 19% distrust of the site with card information, 18% unwanted account creation, and 17% a checkout that’s too long or complicated.
These findings identify problems to audit, not diagnoses of your own customers. Compare recovered and unrecovered carts by device, checkout step, discount, and message type before choosing the fix.
- Unexpected costs: Disclose shipping and fees earlier, and make the message consistent with checkout.
- Delivery concerns: Give a supportable estimate rather than vague urgency.
- Account friction: Offer guest checkout where possible and remove unnecessary fields.
- Payment concerns: Check payment options, brand consistency, and the clarity of security information.
If you can’t reduce shipping costs, set expectations plainly. A message can tell shoppers that their cart is saved and that delivery options and the total cost appear at checkout, without promising savings you can’t provide.
Test the destination before sending more reminders
Randomly split message recipients between a pre-filled checkout link and a cart-page link, while keeping copy, timing, and offer unchanged. Confirm that both destinations work on mobile and preserve the intended products and discounts.
Measure clicks, checkout starts, and completed orders separately. More clicks aren’t an improvement if shoppers then encounter an empty cart, an expired offer, or a confusing checkout.
For the business decision, combine that destination comparison with incrementality testing against a no-message holdout. The destination test identifies the better journey among contacted shoppers; the holdout tests whether contacting them adds value at all.
Fix problems in this order: delivery first, offer second, link and checkout third, frequency last. If messages aren’t reaching shoppers, copy changes won’t repair delivery. If shoppers already reach checkout but reject the total price, more reminders won’t remove that objection.
Audit One SMS Flow This Week
- Choose one live flow and export its recent results. Use the last 30 days as a practical audit period. Pull delivery rate, click-through rate, checkout start rate, conversion rate, revenue per recipient, and unsubscribe rate, keeping the reporting definitions attached.
- Check whether you can estimate lift. Compare conversion against a randomized holdout if one exists. If it doesn’t, an illustrative starting allocation is 10% of eligible shoppers, adjusted through sample-size planning before you interpret the result.
- Inspect the operational safeguards. Review consent evidence, suppression handling, and local sending hours before editing copy. Record any tracking gaps so an apparent improvement doesn’t come from a changed measurement rule.
Keep the audit focused enough to complete.
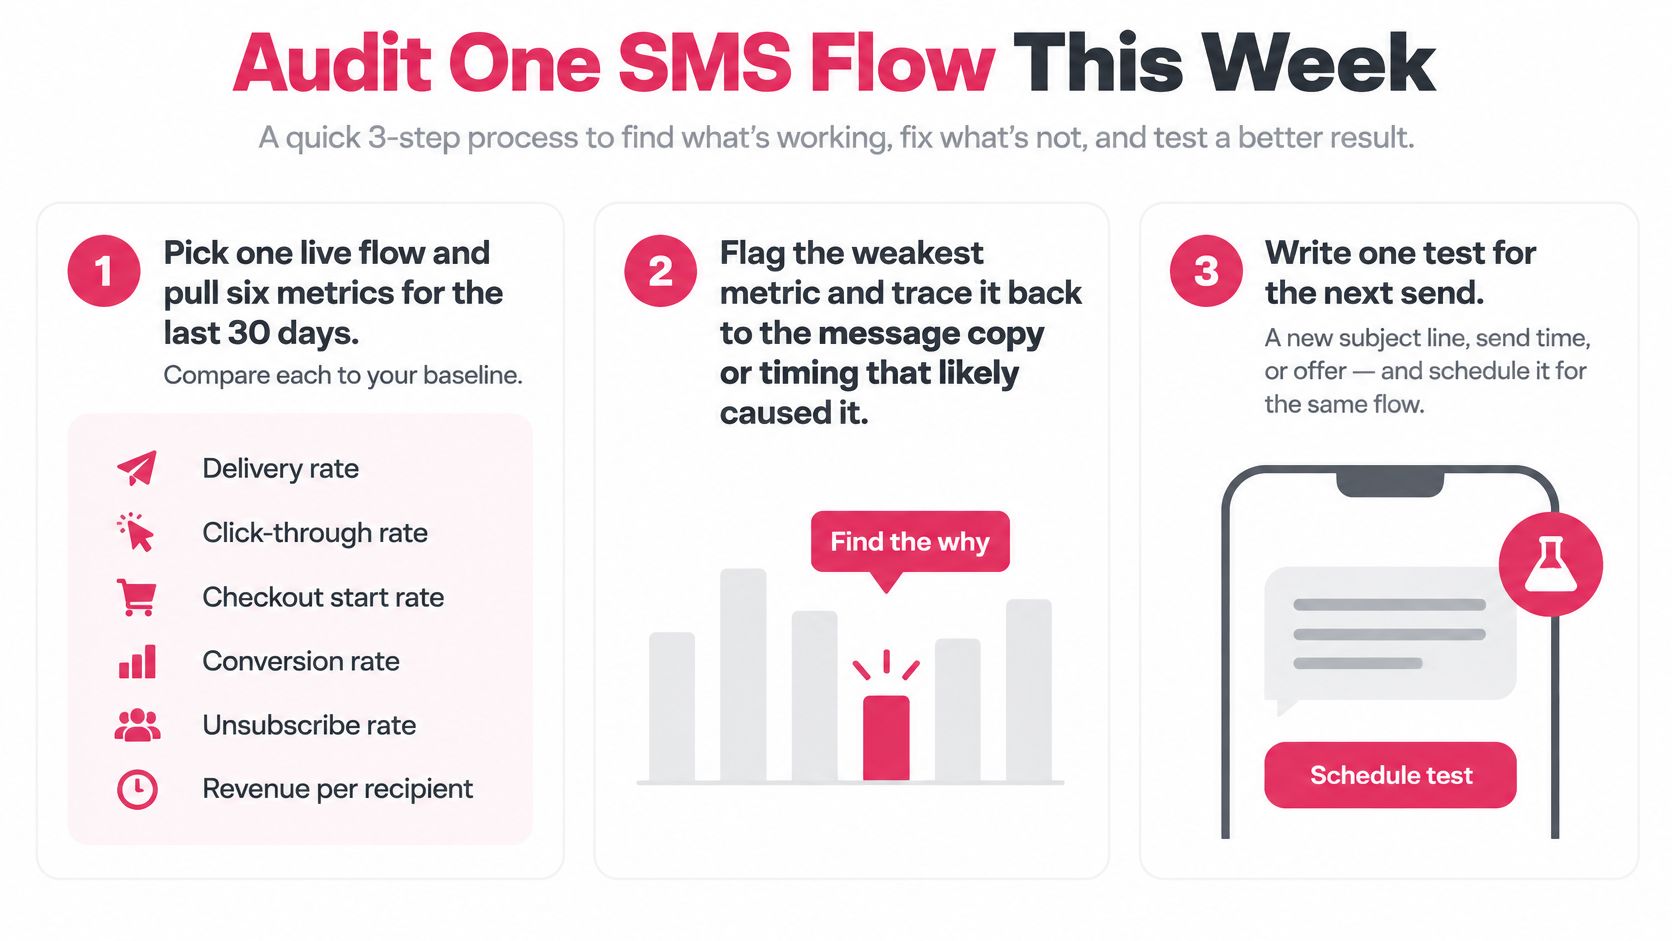
Choose one friction fix, such as clarifying delivery costs, and evaluate it over a complete buying cycle with enough observations to assess uncertainty. Judge incremental contribution after discounts and message costs, not credited sales alone.
CartBoss’s free tools include a Cart Abandonment Rate Calculator, Klaviyo SMS Savings Calculator, and SMS Cart Recovery ROI Calculator. Use them to check assumptions before committing budget, then repeat the same audit on each flow with consistent definitions. A calculator can check arithmetic; it can’t replace a control group.
CartBoss automates abandoned-cart recovery and post-purchase or win-back SMS flows, billed per message. Visit CartBoss to explore those workflows and free calculators, then evaluate your first flow against incremental results, incentive costs, and subscriber health.