


AOV is the average order value, calculated by dividing total revenue by the number of orders. Global ecommerce benchmarks place AOV around $150 to $172, depending on the market, category, device mix, and measurement period.
That range gives you context, but it doesn’t tell you whether your store is healthy. AOV only becomes useful when you connect it to your product mix, conversion rate, acquisition costs, and the value of orders you recover after shoppers leave checkout.
Table of Contents
- What Is AOV in Marketing and Why It Matters
- How to Calculate Average Order Value Step by Step
- Why AOV Directly Drives Revenue and ROAS
- Proven Tactics to Increase AOV in Your Store
- Connecting AOV Growth to Abandoned Cart Recovery
- Measuring AOV Impact Over Time
- Action Plan to Grow Your AOV This Week
What Is AOV in Marketing and Why It Matters
Average order value, or AOV, is total revenue divided by the total number of orders placed during a defined period. Salesforce describes AOV as the average amount a customer spends per transaction and recommends tracking it consistently over weekly or 30-day periods. Salesforce Australia also places the global average order value around $158, while SpeedCommerce’s ecommerce benchmark overview reports a global cross-industry benchmark of $172 based on Dynamic Yield data.
The difference between those benchmarks doesn’t mean one calculation is necessarily wrong. AOV changes by product category, market, season, device, promotion intensity, and the date range used. Your own store’s benchmark matters more than a broad industry comparison.
A transaction metric, not a customer metric
AOV answers one specific question: How much revenue does the average completed order generate?
It doesn’t tell you how much an individual customer spends over their entire relationship with your business. A shopper who places several separate orders is counted several times in the order calculation. That makes AOV different from customer lifetime value, which measures the broader revenue contribution of a customer over time. For a deeper look at that distinction, compare AOV with customer lifetime value in ecommerce.
AOV also differs from related metrics:
- Average basket size usually refers to the number or mix of items in an order, while AOV measures the order’s monetary value.
- Revenue per visitor divides revenue by visitors, so it reflects both conversion and what buyers spend.
- Customer lifetime value considers repeat purchasing and customer duration, not just one checkout.
- Revenue per order is another practical description of AOV, provided the same revenue and order definitions are used consistently.
Why store owners should care
AOV gives marketers a lever they can work on after traffic has already arrived. A shopper who adds a relevant accessory, chooses a bundle, or reaches a free-shipping threshold creates more revenue from the same visit and checkout event.
That doesn’t make every AOV increase profitable. A higher average can come from expensive products, useful add-ons, or excessive discounts, and those outcomes have very different margin implications. The right objective is more profitable value per order, not a larger number for its own sake.
Store owners who want a broader acquisition and retention framework can also review step-by-step digital marketing for jewelry, especially when product education and complementary items influence the final basket.
How to Calculate Average Order Value Step by Step
The formula is simple:
AOV = total revenue ÷ total number of orders
Choose a period first. It might be a week, month, campaign, or product launch window. Then use revenue and orders from that same period. Salesforce confirms that AOV can be tracked daily, weekly, monthly, or over another consistent timeframe, as long as the inputs match.
Follow the calculation
- Select the reporting window. Use the same start and end dates for revenue and order count.
- Pull completed orders. Exclude orders that were cancelled before payment.
- Define revenue consistently. Many ecommerce teams use revenue after discounts and before shipping, but the important point is to document your convention and apply it every time.
- Review refunds. Decide whether refunded revenue is removed from the period. If refunds remain in revenue while cancelled orders are removed from the denominator, your result can become misleading.
- Divide revenue by orders. The result is the average monetary value of each completed transaction.
A Shopify, WooCommerce, or BigCommerce dashboard should let you filter orders by date, status, channel, and product. Exporting the order report can help you reconcile refunds, taxes, shipping fees, currencies, and subscription renewals before calculating the final figure.
AOV calculation example
Use your own dashboard values in this worksheet rather than mixing numbers from different reports.
| Step | Input | Value |
|---|---|---|
| 1 | Reporting period | Same start and end date for all inputs |
| 2 | Eligible revenue | Revenue after your documented discount and refund treatment |
| 3 | Eligible orders | Completed orders in that period |
| 4 | Formula | Eligible revenue ÷ eligible orders |
| 5 | Result | Your AOV for the selected period |
AOV is calculated per order, not per session or per customer. That distinction matters when a returning shopper places multiple small orders, or when one customer completes a single large order. Both behaviors can produce different AOV outcomes even if the customer count looks similar.
Practical rule: Never compare a campaign-level AOV with a store-wide AOV unless the periods, revenue definition, currency, and order status rules match.
Common errors include mixing currencies, including subscription renewals in one period but excluding them in another, counting refunded orders inconsistently, and comparing a promotional weekend with a normal trading period. Use this ecommerce metrics tracking guide to place AOV alongside the other numbers that explain store performance.
Why AOV Directly Drives Revenue and ROAS
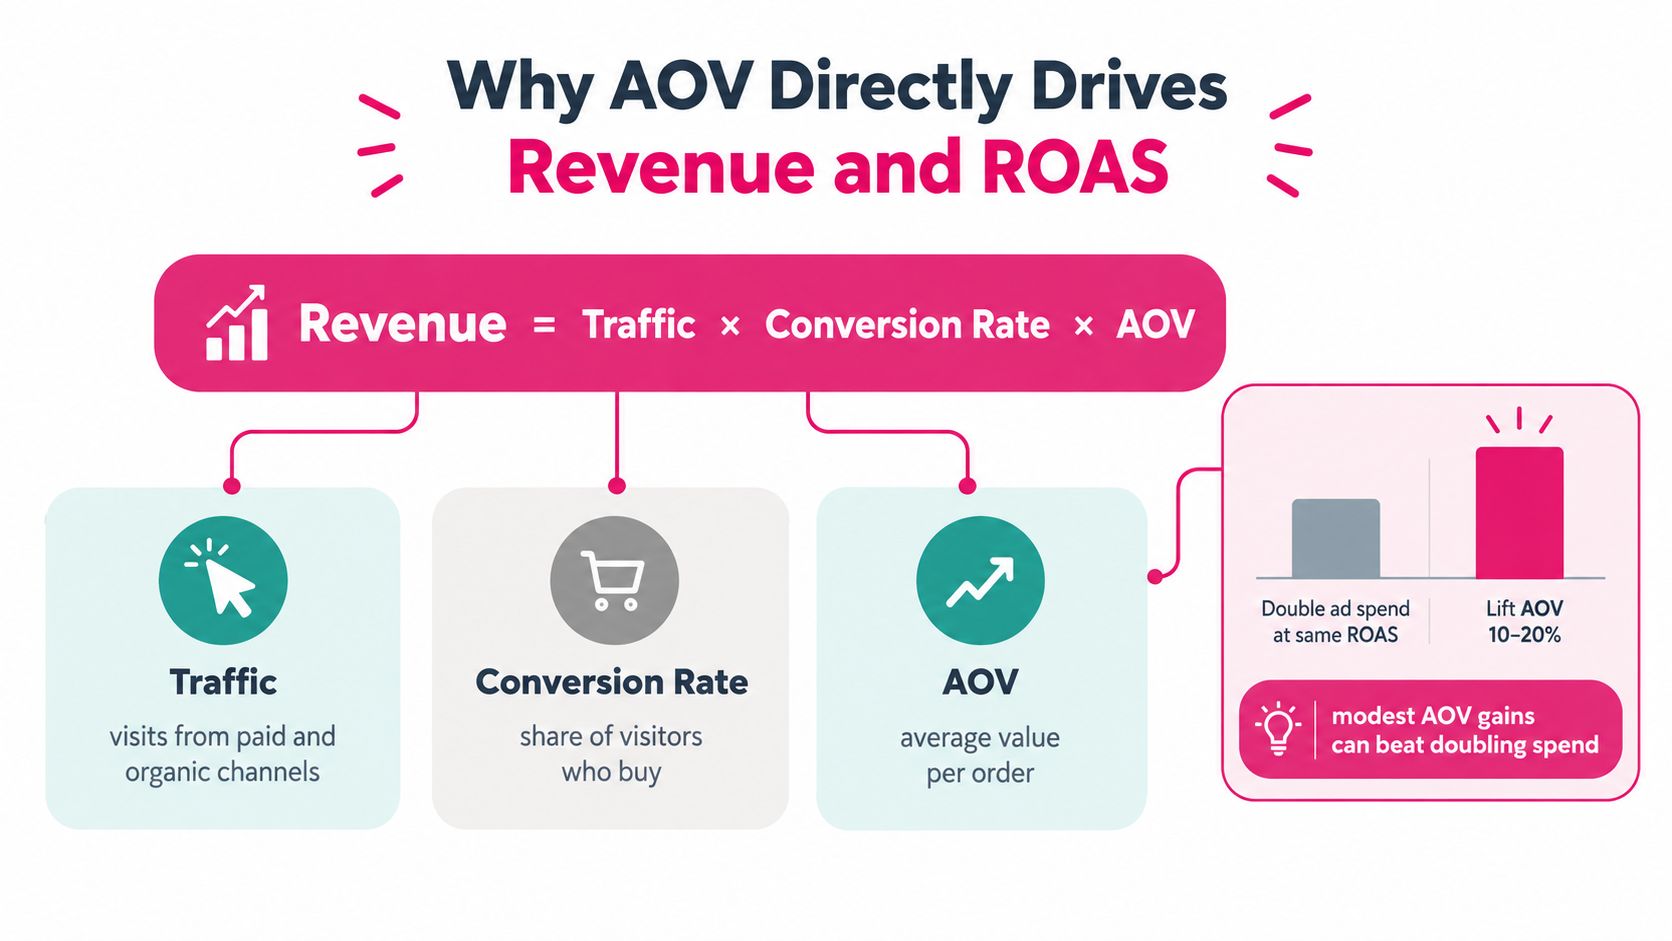
Revenue can be expressed as a straightforward operating equation:
Revenue = traffic × conversion rate × AOV
Traffic brings visitors to the store. Conversion rate determines how many visitors become buyers. AOV determines the value of each completed order. If you focus only on traffic, you ignore the value created after a shopper arrives.
The same traffic can produce different revenue
Suppose two stores attract the same number of visitors and convert them at the same rate. The store with the higher AOV generates more revenue from that identical traffic base. It doesn’t need to buy additional clicks to create the difference.
That distinction becomes important in paid search and paid social. Acquisition costs are incurred before the customer reaches checkout, so a larger basket gives the store more revenue against the same acquisition expense. When product costs, fulfilment costs, discounts, and refunds remain controlled, the additional basket value can improve contribution margin and ROAS.
Return on ad spend is revenue attributed to advertising divided by ad spend. AOV affects the numerator. If traffic, conversion rate, and ad spend stay constant while completed orders become more valuable, reported ROAS can improve.
AOV versus conversion rate
Conversion rate optimization remains essential, but it often requires testing landing pages, product information, trust signals, checkout flows, and pricing presentation. Those changes can take time to isolate because several customer behaviors shift at once.
AOV plays can sometimes be deployed more directly. A merchant can add a relevant bundle, introduce a spend threshold, improve a product recommendation, or test a premium variant without rebuilding the entire acquisition funnel. The tactic still needs measurement, because a larger order isn’t useful if it reduces conversion or destroys margin.
Use this guide to calculating ROAS to connect basket value with campaign economics. The key question is whether AOV rose. Ask whether revenue, margin, conversion rate, and ROAS improved together.
Proven Tactics to Increase AOV in Your Store
AOV increases when shoppers place more valuable orders. The most reliable tactics make the next purchase decision clear, relevant, and financially understandable.
Start with bundles and complementary products
Pair a hero product with an accessory that helps the customer use it. A camera can be paired with a case or memory card. A skincare product can be paired with a compatible cleanser. A jewelry store can group a necklace with matching earrings.
Show the individual product prices beside the bundle price, but protect your margin. The bundle should simplify the buying decision, not merely disguise a discount. If customers already need both products, convenience may be more persuasive than a large price reduction.
Set a threshold customers can understand
Free-shipping thresholds work by giving shoppers a reason to add another item. Set the threshold above your current AOV, then recommend products that help shoppers reach it without forcing an irrelevant purchase.
For example, a store with an average order below its free-shipping cutoff can display a progress message in the cart:
Add one relevant item to unlock free shipping.
The threshold must account for shipping cost, gross margin, return risk, and customer expectations. A threshold that is too high may increase abandonment instead of basket size.
Use checkout and post-purchase upsells carefully
An upsell offers a higher-value version of the item already under consideration. A post-purchase offer appears after checkout and can suggest a complementary product without interrupting the original payment decision.
Keep the offer connected to the order. A buyer who has just purchased a product shouldn’t have to search through an unrelated catalogue. The recommendation should answer a practical question, such as what the customer needs to complete, maintain, or upgrade the purchase.
For more ideas on relevant product pairings, review cross-sell recommendations for ecommerce.
Test volume and premium options
Volume discounts encourage customers to buy more units of a product they already want. A buy-more-save-more structure can lift item count, but calculate the margin before publishing the offer. The discount should reward a larger basket without turning every order into a low-profit transaction.
Premium tiers work differently. They give shoppers a clearer choice between standard and enhanced versions. Use benefit-led comparisons rather than just highlighting the more expensive option. Buyers need to understand what the upgrade does for them.
Reward larger baskets
Loyalty points can support AOV when rewards are tied to spend thresholds rather than only to order completion. A points multiplier for a larger basket gives returning buyers a reason to consolidate purchases.
Curated add-ons can achieve a similar result for new shoppers. Place a final recommendation near the cart or checkout, and limit the choice to products that fit the existing order. Too many options create friction and make the recommendation feel like advertising.
Compare the main options
| Tactic | Typical AOV Lift | Effort | Best For |
|---|---|---|---|
| Product bundles | Often meaningful when products naturally belong together | Moderate | Complementary catalogues |
| Free-shipping threshold | Depends on distance from current basket value and shipping economics | Low to moderate | Stores with predictable fulfilment costs |
| Checkout upsell | Variable and dependent on relevance | Moderate | Stores with clear product upgrades |
| Post-purchase offer | Can add value without changing the original checkout | Moderate | Complementary repeat-use products |
| Volume discount | Strongest when customers need multiple units | Moderate | Consumables and replenishment products |
| Premium tier | Useful when product benefits are easy to compare | Moderate | Products with clear feature differences |
| Curated add-on | Usually simple to test and refine | Low | Stores with a focused product range |
Measure each tactic against conversion rate, discount rate, gross margin, refund rate, and AOV. A tactic that raises order value while lowering profit per order needs a different decision from one that raises both.
Connecting AOV Growth to Abandoned Cart Recovery
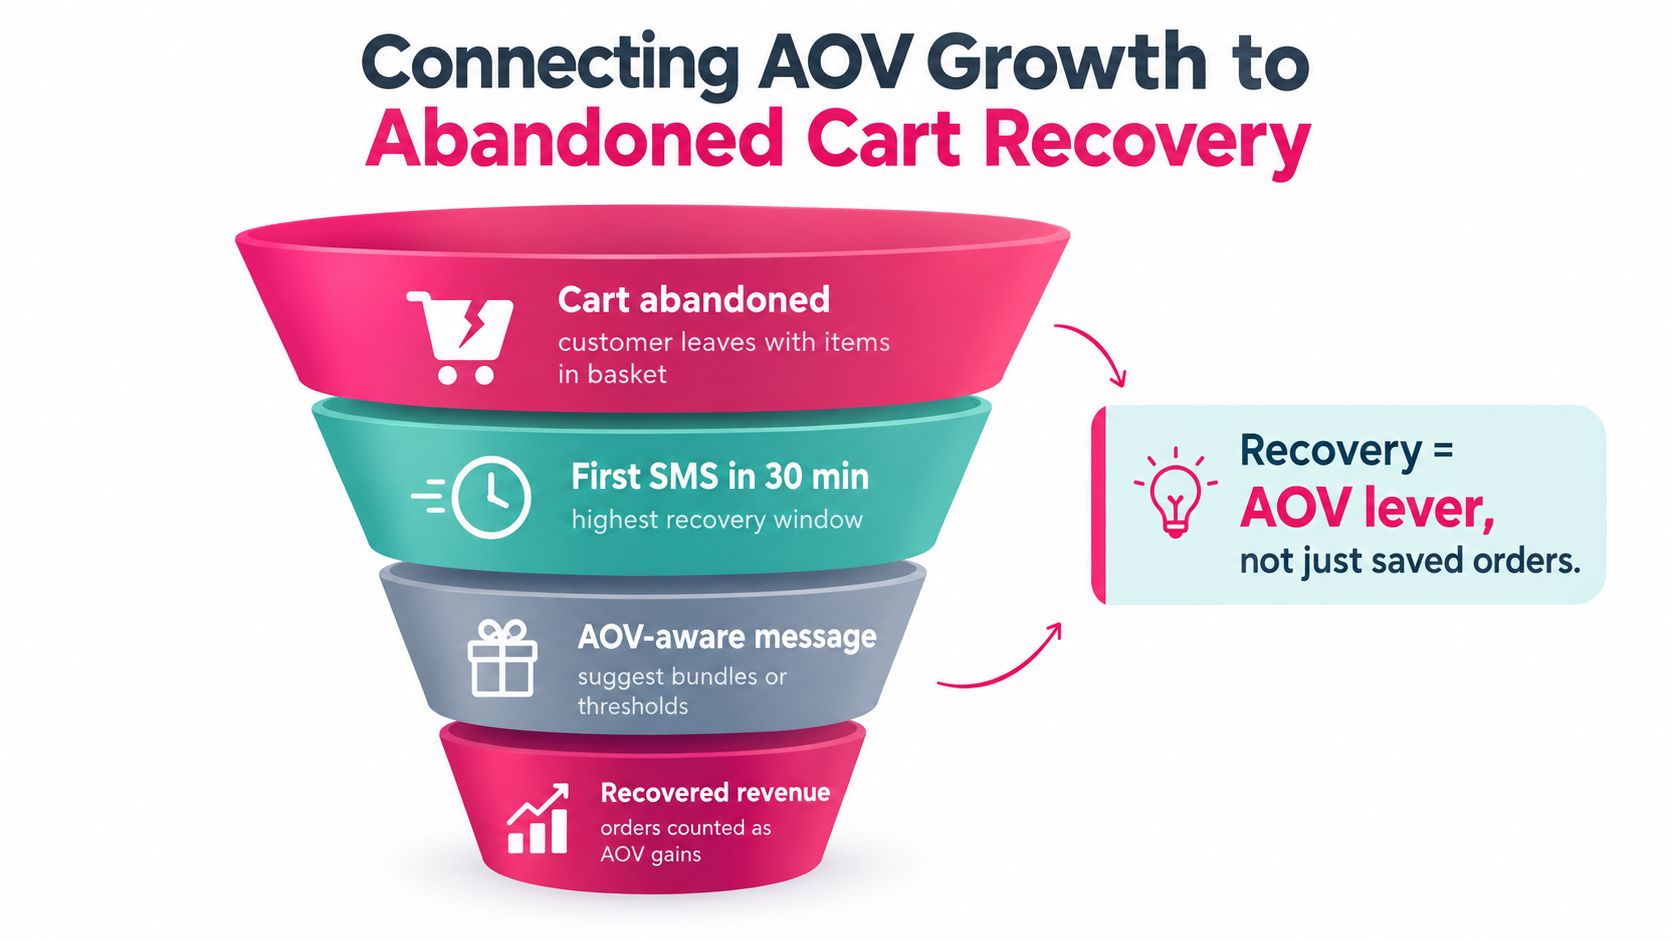
Abandoned-cart recovery creates a second chance to improve both completed orders and basket value. A recovered order with a healthy basket can produce more revenue than one saved only through a heavy discount, so evaluate recovery by the value of each order, not just the number of orders returned.
Customer intent changes after abandonment, which makes timing important. One abandoned-cart SMS recommendation suggests sending the first message 30 to 60 minutes after abandonment, followed by a second message 4 to 24 hours later, with a total sequence of one to three messages to reduce fatigue. Review the abandoned-cart SMS timing guidance from Omnisend before setting up the sequence.
Segment by cart value
A shopper who leaves a low-value cart may need a different message from someone who abandons a high-value basket. Set cart-value tiers using your order distribution, margins, and shipping policy.
A practical sequence looks like this:
- Lower-value carts: Remind the shopper what remains in the cart and remove checkout friction.
- Mid-value carts: Recommend one relevant product or explain how to reach the free-shipping threshold.
- Higher-value carts: Reinforce convenience, product details, delivery information, and a controlled incentive.
A cart just below the free-shipping threshold deserves precise wording. Show the remaining amount and recommend one suitable add-on. The message can recover the original order while giving the shopper a clear reason to increase the completed basket. For setup ideas, see this guide to recovering abandoned cart sales and connecting recovery to basket value.
Measure recovered AOV separately
Track recovered-order AOV separately from overall AOV. Compare these measures:
- Recovered order value: Revenue attributed to the recovery sequence.
- Original cart value: The value recorded at abandonment.
- Added basket value: The difference created by an added product or upgrade.
- Incentive cost: The discount or offer applied.
- Net contribution: Revenue after product, fulfilment, discount, and recovery costs.
This comparison shows whether SMS is returning valuable orders or increasing order count mainly through discounts. Test timing and offers by cart tier, rather than applying one message to the entire audience. Keep SMS brief, opt-in only, and coordinated with the wider recovery sequence.
Before sending promotional texts in the United States, review SMS marketing consent and compliance guidance. Promotional SMS requires prior express written consent under the Telephone Consumer Protection Act, and opt-out requests must be honored through any reasonable method. Document consent, include clear opt-out language, and address sending-number registration requirements before launch.
Measuring AOV Impact Over Time
AOV is a useful signal only when you can explain why it changed. Track it as a management metric, not as a decorative line in a monthly report.
Start with a consistent weekly or monthly view. The same date window, revenue definition, currency, order status, and refund treatment should apply to every comparison. A short reporting window can reveal a campaign effect quickly, while a longer window helps smooth out daily product and traffic fluctuations.
Segment before drawing conclusions
A store-wide AOV can hide important differences. Break the number down by:
- Device: Compare mobile and desktop baskets. Late-2025 ecommerce benchmarks noted that desktop shoppers spent more per order than mobile shoppers, so a mobile AOV gap deserves investigation rather than automatic discounting.
- Channel: Paid search, paid social, email, organic search, and direct traffic can attract shoppers with different purchase intent.
- Customer type: New and returning buyers may respond differently to bundles, loyalty incentives, and premium products.
- Product category: A change in the sales mix can move AOV even when shopper behavior hasn’t changed.
- Season: Compare similar periods, because promotional and gifting seasons can produce different basket patterns.
Cohort views add another layer. Compare buyers who entered through a specific campaign or product launch, then follow their order behavior over time. A higher first-order AOV doesn’t necessarily mean stronger customer value if repeat purchase behavior declines.
Pair AOV with supporting metrics
A rising AOV can be unhealthy if customers receive excessive discounts or if high-value orders generate more returns. Track AOV alongside revenue per visitor, items per order, discount rate, gross margin, conversion rate, refund rate, and ROAS.
Revenue per visitor helps distinguish a stronger basket from a weaker conversion rate. Items per order shows whether customers are adding more products or shifting toward higher-priced products. Discount rate reveals whether the apparent gain depends on sacrificing margin.
Measure the mechanism, not only the outcome. If AOV rises after a bundle launch, confirm that customers bought the bundle, that conversion held steady, and that margin remained acceptable.
Record a baseline before each major change, then review the result at a short check-in and again after a longer period. Tie the movement back to the specific bundle, threshold, upsell, pricing change, or recovery message that was deployed. Without that connection, you won’t know which tactic deserves more budget or wider adoption.
Action Plan to Grow Your AOV This Week
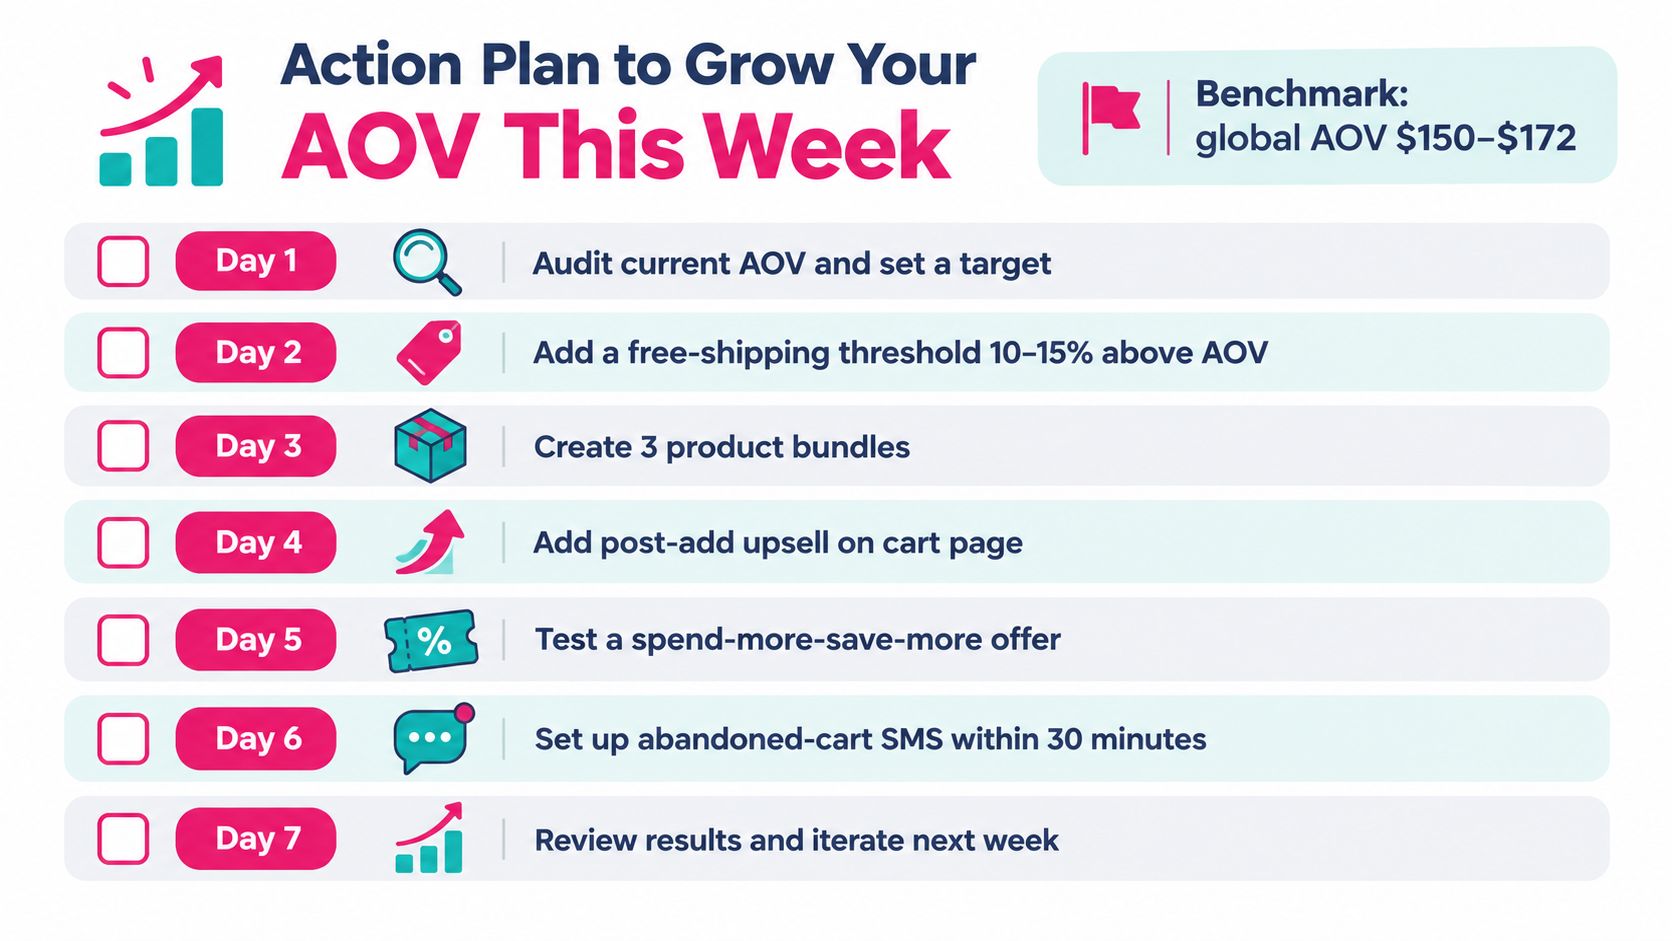
Global benchmarks place ecommerce AOV around $150 to $172, but your store’s product category and customer mix determine the more useful target. Use the benchmark as context, not as a universal goal.
Day one and day two, establish the baseline
Pull your recent order report and document:
- Revenue definition: Record whether your AOV includes or excludes shipping, taxes, discounts, refunds, and subscription renewals.
- Order count: Use completed orders under the same filter window.
- Channel split: Compare paid, organic, email, direct, and other meaningful sources.
- Device split: Separate mobile and desktop orders.
- Product mix: Identify the products and categories that pull AOV up or down.
Flag the lowest-performing cohort, but don’t assume it needs a discount. A weak mobile AOV may point to poor recommendations. A weak paid-social AOV may reflect a mismatch between the ad promise and the landing page. Diagnose the reason before choosing the tactic.
Day three, create a threshold and an upsell
Launch one threshold-based shipping promotion that fits your margin and fulfilment economics. Place a progress message in the cart, then recommend a small set of relevant products that help shoppers reach the threshold.
Add one post-add-to-cart upsell or checkout recommendation. Use a product that complements the original selection, and make the value difference easy to understand. Don’t launch several unrelated offers at the same time, or you won’t know which change affected the result.
Day five, build a focused bundle
Choose two products that belong together, including a slow-moving SKU that doesn’t create a poor customer experience. Set a clear price anchor by showing the combined individual price beside the bundle price. Check the resulting margin before publishing.
The bundle should solve a customer need. If the second item feels arbitrary, shoppers will treat the offer as a discount request rather than a useful recommendation.
Day seven, connect recovery to basket value
Create a short abandoned-cart SMS sequence for opted-in shoppers. The first message should remind the customer about the cart and make checkout easy. A later message can vary by cart value, using a threshold reminder for carts near free shipping and a reassurance-led message for higher-value carts.
Review recovered order value separately from total AOV. Note whether shoppers added products, used discounts, or completed the original basket unchanged.
Avoid the common traps
- Stacking discounts: Multiple incentives can raise basket value while reducing profit.
- Ignoring mobile behavior: A recommendation that works on desktop may be hidden or difficult to use on a small screen.
- Chasing a vanity metric: AOV should support revenue, margin, conversion, and ROAS.
- Changing too much at once: Isolate bundles, thresholds, upsells, and recovery messages so you can identify the cause of any movement.
- Sending without consent: Promotional SMS requires documented permission and a clear way to opt out.
CartBoss helps ecommerce stores automate abandoned-cart SMS recovery, send short reminder sequences, apply targeted promotions, and provide pre-filled checkout links for shoppers who leave before completing an order. Visit CartBoss to connect your recovery flow with an AOV-aware strategy and start measuring recovered revenue by cart value.